This post provides a detailed examination of the detection, location, and diagnosis of faults in a locomotive alternator using vibration analysis. Health of the alternator, or any rotating machine for that matter, can be assessed by collecting and analysing vibration data. Vibration provides a valuable insight that if timely actioned can prevent unscheduled breakdowns and or costly repairs.
But, before going any further I would like to share with you what was I told some time ago: “Conducting vibration analysis in order to determine bearing condition should not be done for the purpose of “do I need to replace the bearing immediately”, but to assess bearing integrity and ability of the bearing to reliably perform its function. No bearing is designed to produce visible fault frequency if operates normally and is in good condition.”
Firstly, I will quickly cover required tools and move on to the review of acquisition and processing of signals followed by analysis and suggestions.
Hardware & Software
For this exercise following resources were used:
- Digiducer, piezoelectric digital accelerometer
- Our personal mobile Android phone
- VibCloud, vibration data collection and analysis solution

Bound together they provide a powerful vibration monitoring system that allowed us to:
- Digitalise the locomotive and its components in the system
- Effortlessly collect data
- Perform the analysis and
- Recommend actions to the client
Here is worthwhile to mention — as I am writing this post during the COVID-19 pandemic, machine setup, analysis and recommendations were done remotely. Also, direct contact was eliminated by eliminating need for travel to conduct data collection.
Measurements
Before taking the measurements, we should take time and gain an understanding of the equipment we will be measuring. For example, recognising dominant forcing frequencies is important as those will assist us with analysis and diagnostics at later stage. Below are listed some of those frequencies and associated root causes:
- Rotational frequencies — unbalance, misalignment, looseness
- Lobe meshing frequency — pressure pulsation
- Line Frequencies — electrically induced
- Bearing fault frequencies — bearing condition related
- Friction related frequencies (hump) — lack of lubrication, rub
- Transmitted frequencies — from nearby equipment
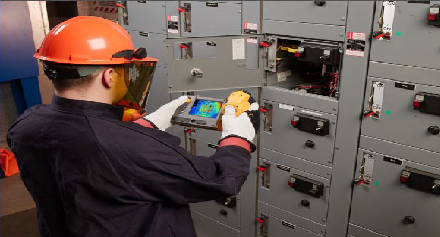
Next step is to mark the measurement points. You can create a simple sketch of the machine or work from the machine photo like in the example below. This is not a necessary step and more experienced users will go directly to creating those points. Nevertheless, we do recommend it as it is much better for yourself to make sure entire equipment is covered as well when communicating with the person taking the measurements — visualisation helps.
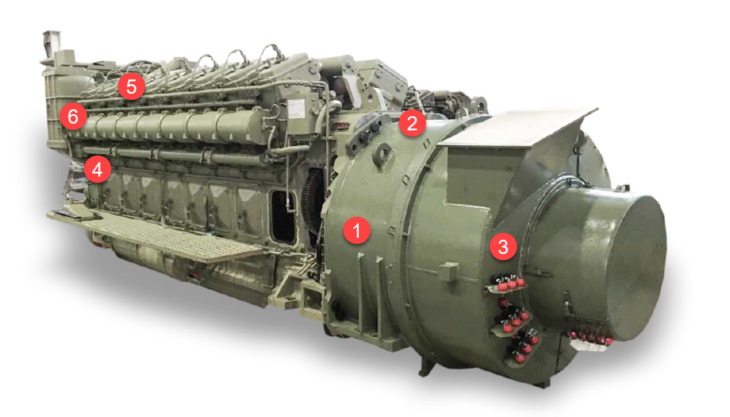
Locomotive alternator with marked measurement points
Now we can go and create those measurement points in the system and schedule the data collection for execution. Part of the measurement point creation is also selecting the right signal processing parameters, like number of lines, number of averages, F Max and HP Filter. Signal processing parameters are not part of this article, but we wanted to stress that over time you should be tuning those settings and make sure they are fit for your purpose. There is always a space for improvement.
Once measurement points are set and scheduled for execution in the system, we can do the actual measurement on the field. Mobile device will have all necessary information of the machine and points we need to collect data from.
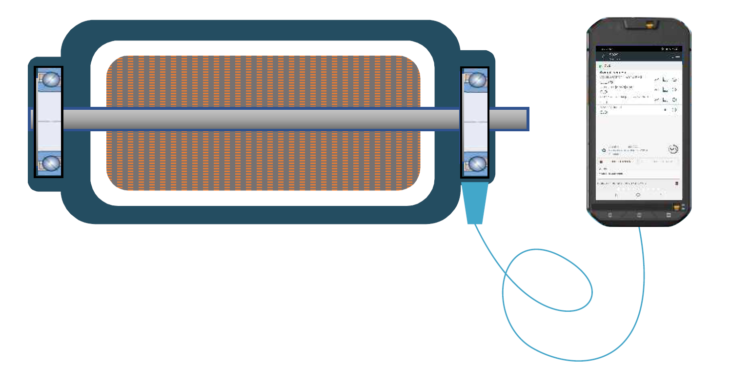
Data collection using smartphone
If you choose a more modern system, it will allow you to do quick analysis straight after data collection is complete on the actual mobile device. On the spot you will know if there is a major problem with the machine. Most of our analysis were done on the web portal and will be discussed in the next section.
Analysis
The locomotive alternator that we are analysing has operating speed of 443.1012 rpm and 1xFreq of 7.38502 Hz. All signal processing and calculation shown here is done by VibCloud mobile app when collecting data. Also, it allowed us to capture raw wav file, acceleration recording, that we can play back on the field or back in the office. Playing the signal, we can clearly hear the rumbling noise.
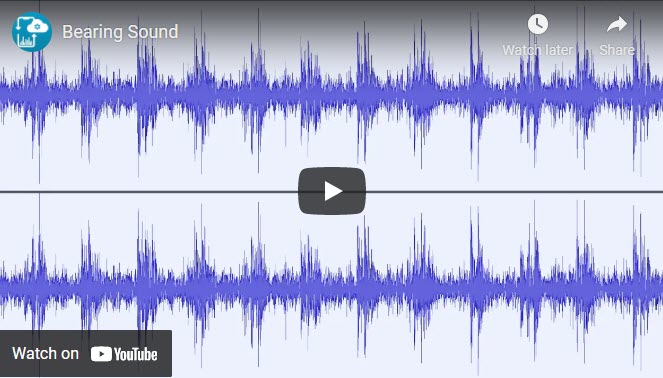
Bearing rumbling noise
With closer look to the acceleration signal we can detect impacts.
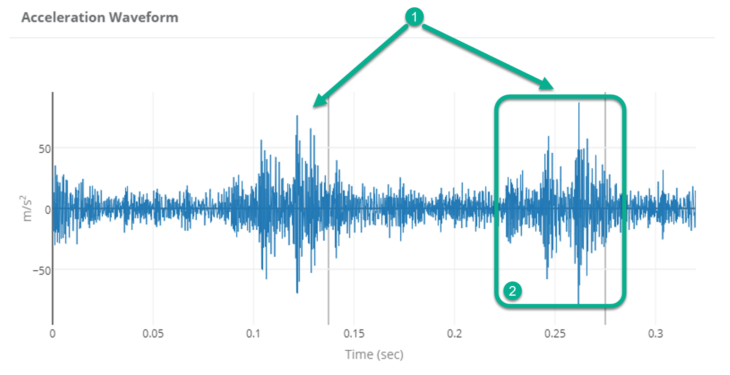
Acceleration time waveform
- Knocking is clearly visible in acceleration time waveform
- Looks like there are three stronger impacts and several smaller impacts distributed evenly
- Knocking — we suspect that metal to metal contact is causing bearing race ringing — noise we can hear.
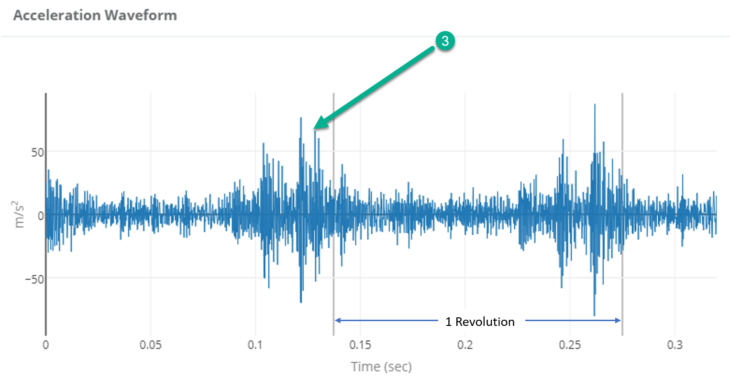
Acceleration time waveform — knocking
The resulting ringing after impact is visible in acceleration spectra as a hump at high frequency.
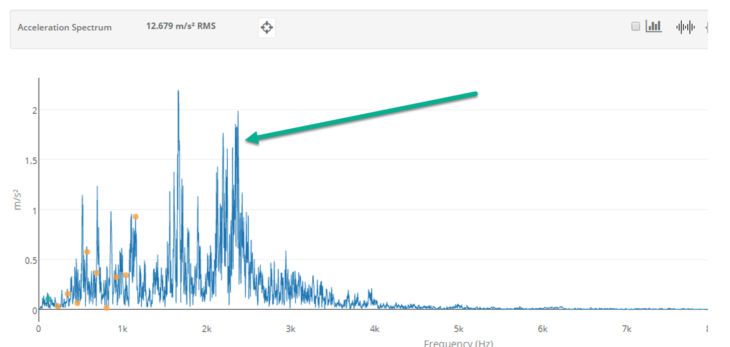
Acceleration spectrum
We move on and then use demodulation to determine the rate of knocking. Demodulation will help us to better understand the impact rate so we can determine what may be causing these impacts. It is calculated from acceleration signal with some data processing.
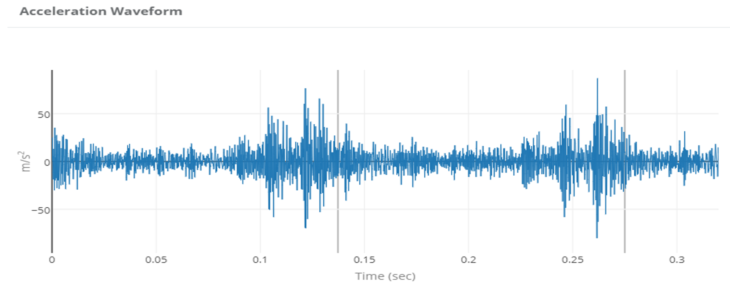
Acceleration waveform — two revolutions
Above is presented short acceleration time waveform — about two revolutions of the shaft. For demodulation we need longer time waveform. Therefore, we take time waveform. Here we can see more revolutions of the shaft and, we can see how impacting has repeatable pattern.
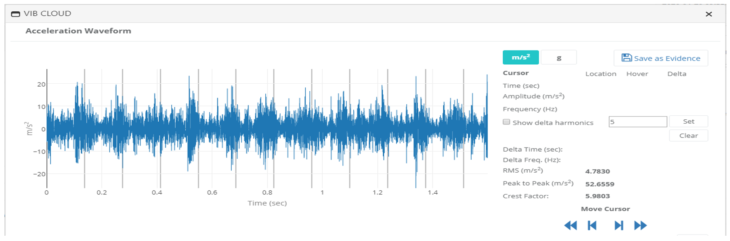
Longer signal recorded for analysis of the knocking
Now we continue processing the signal. First, we band pass the signal to only analyse hump we suspect to be related to the ringing noise. In this case that is the region above 2kHz. We can go lower, but it may introduce additional sources not necessarily related to the ringing we observe.
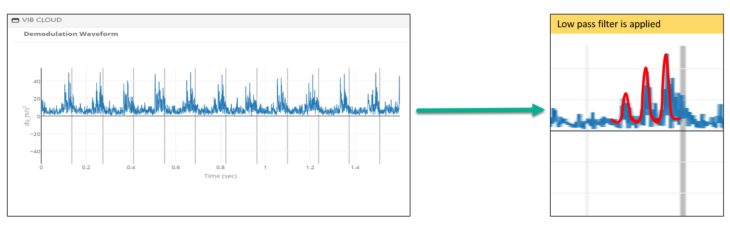
After band pass filtering, we rectified the signal, so it is all positive which helps to further highlight the impacts. This is shown on the screen below.
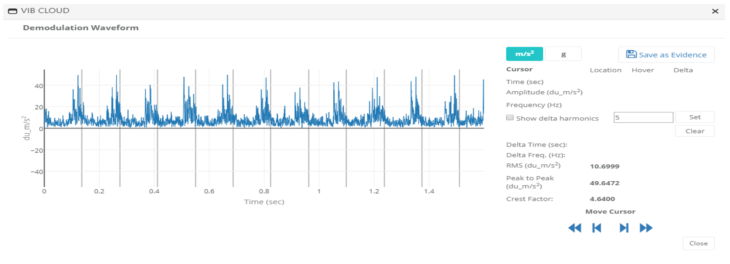
Demodulation waveform
Low pass filter is applied to smoothening the signal
Demodulation waveform
After we rectified the signal, we pass that signal through a low pass filter. This step acts as an envelope, basically smartens all peaks and make them as a smoother sinewave. The amplitude and shape of this new time waveform follows the contours of the rectified acceleration signal.
Impacts are clearly more visible now. Now we can generate spectrum from this smoothen time waveform.
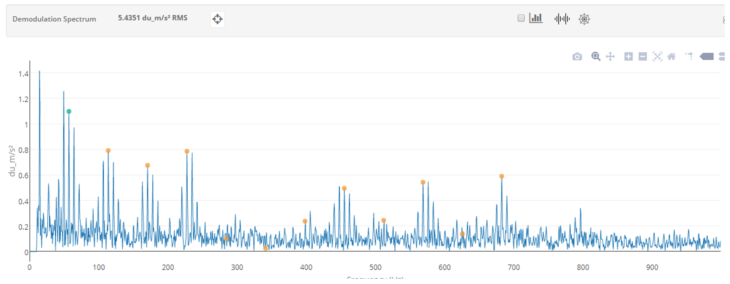
Demodulation spectrum
The process of rectification and low pass filtering is remarkably similar to what is known in AM radio communication as amplitude demodulation. That is why we name this simple demodulation spectrum.
Analyze demodulation spectrum
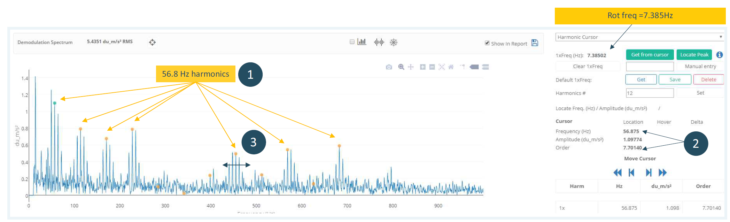
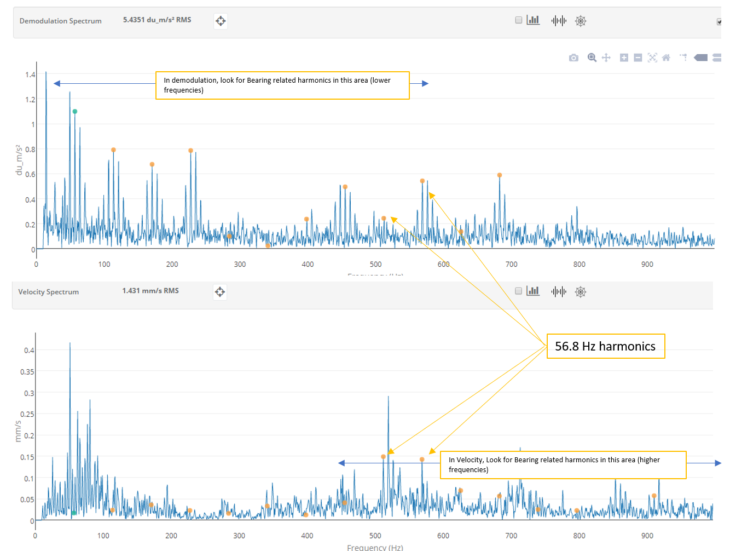
- We can see some regular pattern in the demodulation spectrum. Using harmonic cursor, we can see this pattern has 56.8 Hz harmonics — Impact is at 56.8 Hz
- We know the rotational frequency is 7.385Hz, so we look for order of our peak of interest (divide frequency of interest with rotational frequency). Multiplier is 7.7x — Impact happens 7.7 times per revolution (7.7th order)
- We also observe sidebands around each of the harmonics. Using sidebands courser in VibCloud, we can determine what is the spacing between the harmonic and its sidebands. This reviled that the spacing is related to rotational frequency (7.385Hz spacing) — 7 order peaks have rotational speed sidebands (7.385Hz)
With this information we can conclude with high degree of confidence that there is a strong possibility of bearing deterioration casing these impacts.
In addition, having sidebands around each harmonic indicates further modulation of the impact once per shaft revolution. This can be caused by the inner race part of the bearing — as inner race rotates, per revolution the actual damage on the race gets closer to our accelerometer (stronger peaks).
Finally, we can conclude that there is strong indication an inner race damage of the bearing. Bearing needs to be replaced to ensure equipment reliability.
Analysing velocity spectrum
In this case, from acceleration and demodulation analysis, we conclude that there is a strong possibility of bearing inner race deterioration.
Demodulation and velocity spectra
Velocity spectrum can be used to further understand the severity of the problem. In most cases, if we can see the harmonics of the bearing inner race fault related peak in velocity spectrum, it means the damage is more serios and advanced.
The top graph on the image above is demodulation spectrum and bottom is velocity spectrum. Using harmonic cursor, we can see if there is presence of harmonics of the observed bearing fault frequencies.
We can see that bearing inner race defect frequency is visible in velocity indicating that damage more advanced. This confirms our diagnosis and also helps to make final conclusion — change the bearing if you want reliable operation.
How to use sideband cursor
We mention use of sideband cursor to determine which race may be responsible for the observed harmonic. To do that we use sideband cursor.
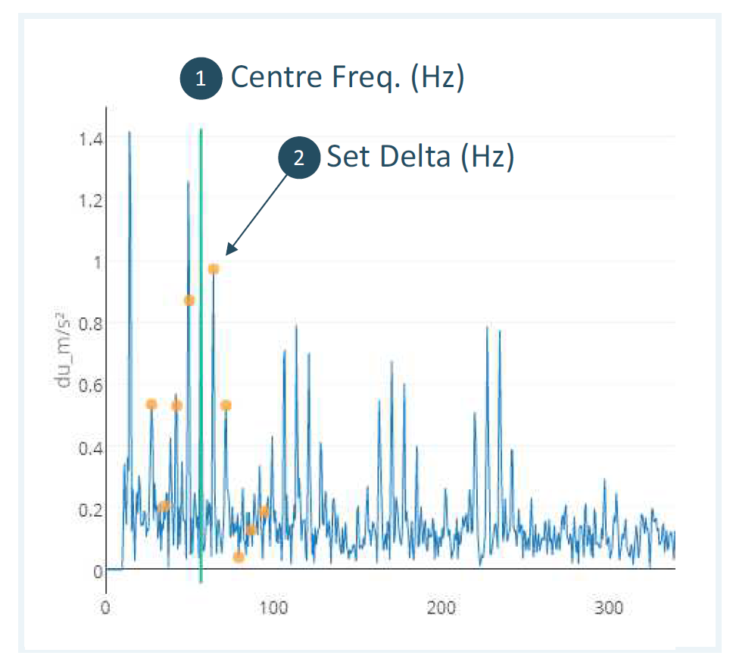
Sideband cursor
- First, we select the frequency of interest (in this case 58.875Hz peak) as a Centre frequency
- Second, we place sideband cursor on one of the surrounding peaks and mark this as “set delta” in VibCloud. We can move this delta cursor until we find good match of sideband harmonics with as many as possible surrounding peaks. We can now compare this delta frequency with let’s say rotational frequency. In this example, delta frequency is equal to the rotational frequency, which helps us to suspect inner race defect.
How to use library of bearings fault frequencies
If we know bearing designation or bearing dimensions including the number of balls / rollers, we can calculate expected bearing fault frequencies.
VibCloud has over twenty thousand bearings with corresponding bearing fault frequencies. Also, there are online libraries by bearing manufacturer that can be used to find fault frequencies.
There are four typical bearing fault frequencies: FTF, BSF, BPFO and BPFI.
FTF — Fundamental train frequency (Cage rotational frequency)
BSF — ball (or rolling element) spin frequency
BPFO –ball (or rolling element) passing Outer race frequency
BPFI — ball (or rolling element) passing Inner race frequency
As bearing details were unknown in this case, searching the database revealed one bearing (Koy 7330) to be a match — its bearing inner race fault frequency (multiplier of 7.7x matches observed frequency in demodulation spectra (multiplier of 7.7 times).
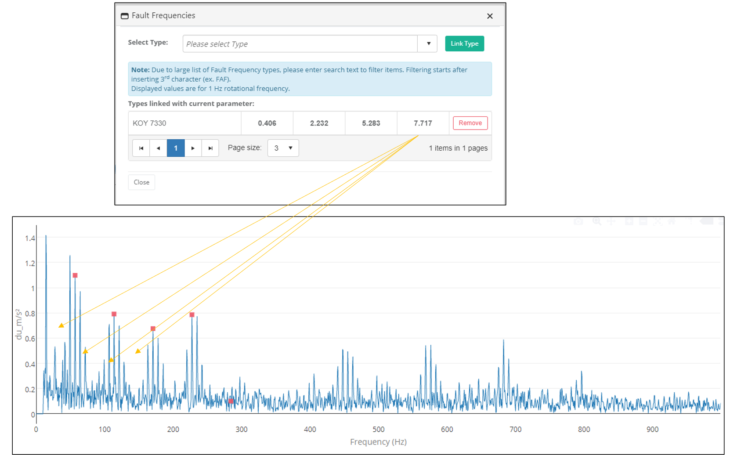
Display (superimpose) fault frequency and its harmonics on the spectrum
We can now see a good match between bearing fault frequencies from the VibCloud bearing library and measurements taken on this alternator bearing.
Summary
In this article, we have demonstrated how to analyse vibration in order to determine bearing conditions. Even though we did not know exactly what bearing is being installed, we can confidently say that we have a vibration pattern typical for an inner rave bearing problem.
We use full VibCloud capabilities to diagnose this problem by following these steps:
- We started with listening of the recorded acceleration wav file and noticed a rumbling noise
- Then, we observed in the acceleration time waveform regular impacting(short sharp spikes)
- We looked at the demodulation spectrum and identified that the impacts were happening 7.7 times per revolution. As this is not an integer, it is likely that pattern is caused by a bearing problem. We also found sidebands related to shaft rotational frequency which made us to suspect bearing inner race defect
- Velocity spectra also showed higher frequency harmonics of the suspected impacting frequency. This indicated that the damage is advanced
- We can now recommend an action to replace the bearing to ensure reliability and integrity of this unit.


Very good formation
Thank you Hussein
can you sent me more knowledge about vibration for CAT I and CAT II because i want attend training
We are not proving vibration training, only solutions. If you want to learn more about the solution discussed in the post please visit https://vib.cloud/
A complete step by step explanation. Loved the way you explained not just Bearing associated faults but also the signal processing part along with the reason of doing so..!!
Looking forward to get more such content from you.
Thank you..!!