Any time a piece of machinery is running, it is vibrating.
Industrial vibration analysis refers to a process for measuring the vibration levels and frequencies of machinery and then using this information to assess the “health/condition” of the machine and its components.
A Brief History
While vibration analysis of industrial machinery has been around for decades, it gained prominence in the 1970s with the introduction and widespread use of personal computers. This, along with the advent of digital signal processing, led to the development of the FFT analyzer which made calculating a frequency spectrum from a recorded vibration signal quick and easy.
When digital signal analyzers were coupled with computer programs that stored the data collected, it completely revolutionized the application of vibration analysis on industrial machinery and paved the way for it to become the invaluable diagnostic tool it is today.
How it works
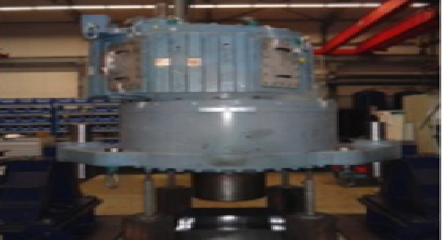
In rotating machinery, vibration occurs during normal operation as a result of friction and centrifugal forces of both the rotating parts and the bearings. Vibrational force is transmitted out, away from the source, into the machine housing, supports and foundation.
An accelerometer, the tool most commonly used to measure machine vibration,
attached to a machine generates a voltage signal that corresponds to the amount of vibration and frequency of the vibration the machine is producing, normally how many times per second or minute the vibration occurs.
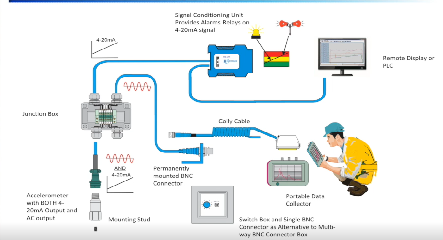
The voltage acceleration signal is digitized by a data collector (see Figure 1), which records the signal as either a time-waveform (amplitude vs. time), and/or a spectrum (amplitude vs. frequency) via the Fast Fourier Transform (FFT) process.
All data is then analyzed by a trained vibration analyst and/or by using “smart” computer program algorithms to determine the “health” of a machine and identify any possible pending issues.
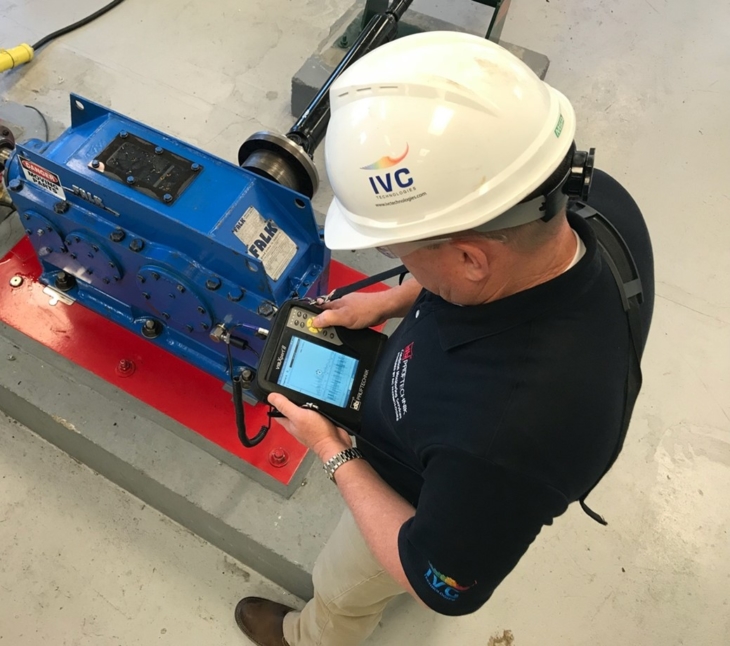
Figure 1: Vibration analysis using the VIBXPERT II by PRUFTECHNIK
Types of machines that vibration analysis is used for include:
- Fans
- Pumps
- Generators
- Compressors
- Gearboxes
- Blowers
- Turbines
Vibration analysis can detect problems such as:
- Misalignment
- Bearing wear
- Imbalance
- Gearbox wear
- Mechanical looseness (i.e. excessive clearance or improperly fastened)
- Bent shafts
- Resonance
- Electrical issues including windings, rotor bars and VFD tuning
- Cavitation / flow related
The Components of Vibration
Vibration is defined as the movement of a body about a reference or starting position; a change of force in magnitude or direction. Vibration is identified by the following components:
- Frequency – Used to determine how often a vibration is occurring
- Amplitude – Used to determine the severity/magnitude of a vibration
- Phase – Used to determine the relationship between two signals of the same frequency, measured in degrees
Data Types
Depending on the source of vibration, the complexity of the problem and the resources available, an analyst may focus their attention primarily on one of four areas:
1.Trend data
Trend analysis may be overall or band filtered measurements from the spectrum and waveform. Evaluation of multiple parameters over a long period of time may give insight to complex problems that would not normally be observed with a narrow focus. Trend analysis is also used as a screening tool for deeper analysis.
2.Time domain data
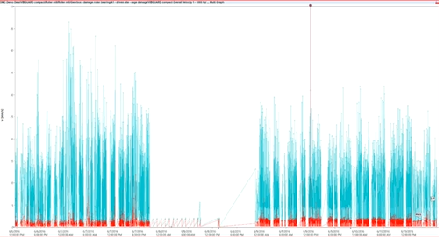
Time domain refers to the variation of amplitude of a signal over time. When a vibration signal is detected from a transducer (a device that converts physical quantity into an electrical signal) it is displayed on the screen of an oscilloscope as a waveform (see Figure 2). Characteristics in the signal represent forces within the machinery over time.
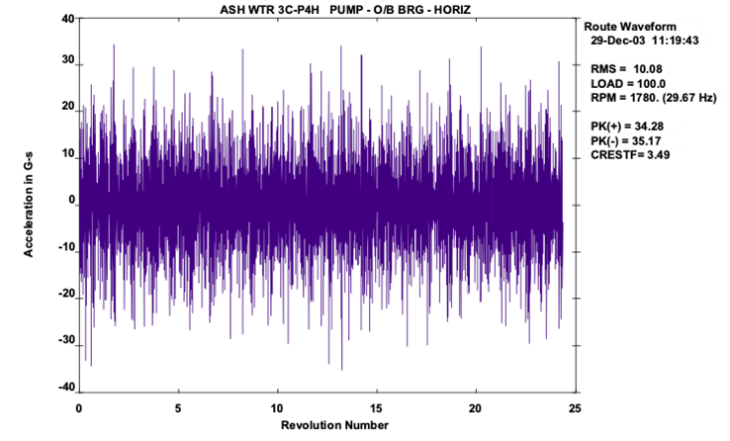
Figure 2: Example of a time waveform
3.Frequency domain data
With frequency domain data, a waveform is subjected to spectrum analysis which measures the magnitude of a signal (amplitude) vs. the frequency, within the full frequency range if the instrument. The picture/graph created is known as a spectrum (see Figure 3). The vast majority of in-depth analysis of machinery vibration is done in the frequency domain or using spectrum analysis.
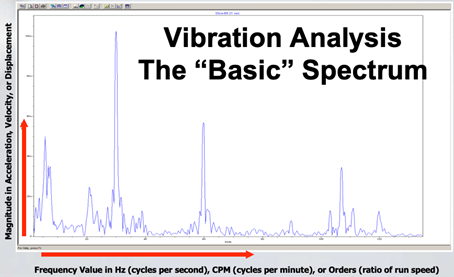
Figure 3: Example of a basic spectrum
4.Phase data
Structures and machines vibrate or deform in particular shapes and phase shows how the various locations that vibration measurements are taken move or vibrating relative to each other. Phase can be used for simple checks across a coupling, or above and below a mount that is suspected of being loose. Phase data can also be used in more complex methods such as Operating Deflection Shapes (ODS) and Modal Analysis which are used for a much more in-depth analysis of structures which can include both there static and dynamic characteristics based on mass, stiffness and damping.
Forms of Vibration Analysis
Many different forms of analysis, calculations, and algorithms are used to determine various aspects of vibration analysis. In addition to advanced analysis techniques and plots such as Power Spectral Density, Cepstrum, Bode, and Nyquist, the most commonly used methods include:
- Time Waveform
A time waveform is a plot or graph of the displacement, velocity or acceleration verses time. Time waveforms show exactly what happened inside a machine from one moment to the next, revealing clues as to the condition of the machinery that aren’t always clear in the frequency spectrum. Any time the vibration might include periodic impacts, beats, rubs, modulation, transients and random bursts of energy, time waveform analysis data is the best to use. Fault conditions ideal for using time waveform for diagnoses include:
-
- Rolling element bearings
- Looseness
- Transients
- Rubs
- Random energy bursts
- Spectral Analysis (Fast Fourier Transform – FFT) The FFT is an algorithm used to convert a signal in the time signal to a frequency spectrum. It enables an analyst to see which frequencies are present in any analog signal and which are most dominant. The spectrum is often the most easily understood vibration data which is used for detecting one or more machine faults with a single data plot.
- Phase Analysis Phase is the relationship between two signals of the same frequency, measured in degrees (see Figure 4). Phase is independent of amplitude. That is to say that each signal may have different amplitudes and still be evaluated for specific phase characteristics. Phase analysis is used in conjunction with the spectrum to distinguish one machine fault from another such as misalignment, imbalance, and looseness.
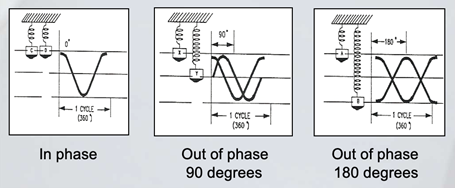
Figure 4: Example of phase analysis
- Order Analysis Order analysis is a variation of spectral analysis and is used to quantify noise and vibration in rotating machinery whose revolutions per minute (RPM) changes over time (see Figure 5). The term “order” refers to a frequency that is a multiple of a reference rotational speed. For example, for a vibration signal with a frequency equal to twice the rotational frequency, the order is two; likewise, a vibration signal with a frequency equal to 0.5 times the rotational frequency would have an order of 0.5.
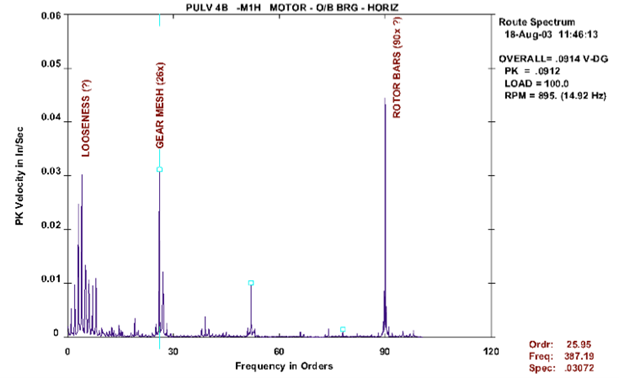
Figure 5: Example of a spectrum showing frequency in orders
- Resonance Analysis Resonance is the result of a generated force having the same frequency as the natural frequency of a system. Resonance analysis is used to identify a machine’s natural vibrations and frequencies. The presence of resonance is indicative of high vibration, which could reach damaging levels if not addressed.
- Envelope Analysis Envelope analysis is a well-known technique that can cull low-energy impacts often hidden by other vibration signals. This type of analysis is primarily used to detect and diagnose roller bearings and damaged gear teeth in the early stages.
- Orbit Orbit plots provide a map of the path a rotor takes as it vibrates in its bearings. This enables a clearer picture of what is causing the vibration. Measurement is done by placing two probes in the bearing housing, 90 degrees apart. The Orbit is a representation of the position of the shaft centerline as it rotates.
Measurement Units
Vibration analysis techniques help to identify three major units: acceleration, velocity, and displacement. Each unit uniquely emphasizes a certain frequency range and when utilized together, can provide a comprehensive diagnosis of machine issues. (See Figure 6)
- Acceleration Acceleration is the change in velocity with respect to time. It accentuates high frequencies (above 120,000 cpm) and is frequency dependent. Common applications include high speed compressors, gear mesh, bearings.
- Velocity Velocity refers to the speed a mass is moving during oscillation. It is not frequency dependent (i.e. it places equal importance on both high and low frequencies – between 600 cpm and 120,000 cpm).
- Displacement Displacement refers to the total amount of movement of a vibrating system and accentuates low frequencies (less than 600 cpm). A common application is balancing.
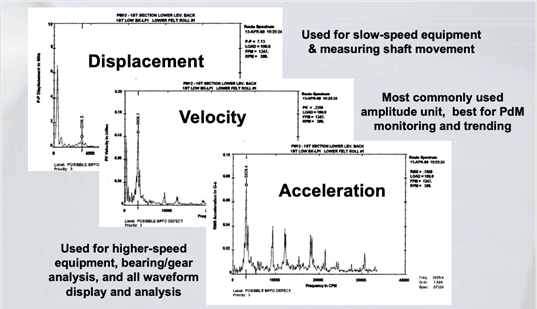
Figure 6: Measurement units of vibration analysis
Signal Processing
- Overall Level The overall level is a summation of the energy content measured and a good general indicator. Consider this like a “rough check” of a machine’s vibration. By simply placing your hand on the machine, you can get a general feel as to whether a machine is vibrating beyond what would be considered normal. This initial check works best on high-speed, rotating machinery. It’s usually not suitable for reciprocating machines. This measurement is similar to the temperature when referring to the weather. Additional indicators should be considered when planning an outdoor activity.
- Signal Averaging Signals change with time. Averaging helps to reduce random noise, thereby reinforcing constant frequencies and making low amplitude signals, which would normally be buried in the noise, visible for better analysis.
- Discrete Frequency Monitoring Discrete frequency monitoring is utilized when there is a need to monitor a specific component within a machine. It measures the vibration level being generated at a particular frequency which that component would be expected to generate. It is calculated using the FFT algorithm.
- Shock Pulse Monitoring When two pieces of metal touch each other while in motion, stress waves develop from the impact which quickly propagates through the metal. This stress wave is what is measured to monitor the condition of rolling-element bearings.
- Kurtosis Measurement Kurtosis is used to monitor the development of fatigue in rolling bearings by monitoring the size and quantity of peaks in a random signal. Signals with a higher kurtosis value means that it has more peaks that are greater than three times the signal’s root mean square (RMS) value.
Tools and Technology
Data is the lifeblood of vibration analysis.
Industry 4.0 and all of its technological advancements have enabled vibration analysts to collect, interpret and share data, faster and more accurately than ever before.
- Sensors While accelerometers remain the “go to” tool for collecting vibration data, the emergence of wireless sensors and noncontact, high-speed laser sensors are able detect machine issues that accelerometers have historically overlooked.
- Data Analyzers Today’s models are lightweight, portable, and able to communicate with smartphones and tablets, providing analysts with real time, high resolution FFT data right at their fingertips…wherever they are, whenever they want it.
- Software
- Modal & Operating Deflection Shape (ODS) Modal & ODS are two different data acquisition methods that are used with animation software to transform collected data into a 3D model and then exaggerate vibration-induced movements in order to better visualize forces impacting a machine while it’s running.
- Motion Amplification™ With Iris M, a revolutionary video-processing and software package developed by RDI Technologies, our analysts use a high speed, high definition camera to collect video data. The software and processing algorithms detect subtle motion and amplify it, essentially converting every pixel into an independent sensor, creating millions of data points in a matter of seconds. In the image below (see Figure 7), the left side is what the naked eye sees and the right side is the same structure with its motion amplified.
Figure 7: Motion Amplification in action
- Cloud Technology/Computing Cloud technology/computing simply means storing and accessing data and programs over the internet instead of on a computer’s hard drive. By having data upload to the cloud (the internet), the data is accessible on mobile devices, tablets, computers or directly from a browser.
Vibration Analysis – The Proven Foundation
Maintenance generally accounts for a significant portion of production costs. Being able to monitor the condition of industrial machinery and detect problems at an early stage, before a catastrophic failure occurs and leads to an unexpected shutdown of a production line, is a game changer. Vibration analysis has stood the test of time as a key component of a solid overall condition based monitoring (CBM) plan.
Technology will undoubtedly continue to evolve and make things better, faster, and stronger…including vibration analysis. Manufacturers can and should take advantage of the many benefits of digitization and connectivity that the Industrial Internet of Things (IIOT) already provides.
A Great Starting Point
At IVC Technologies, we understand that every manufacturing company’s needs are different. There is no such thing (or at least there shouldn’t be) as a “cookie-cutter/one size fits all” condition based monitoring (CBM) plan. We also understand how overwhelming setting up a CBM plan can be.
Vibration analysis is an excellent place to start. It’s a reliable foundation upon which to build out a comprehensive predictive maintenance (PdM) plan over time…at your own pace.
IVC Technologies is the nation’s leading provider of condition based monitoring services and vibration analysis is our core competency. Our highly trained and certified professional vibration analysts review your database content, construction, analysis parameters, and validating parameters for equipment types to enable identification of possible failure modes in the future.
IVC will prepare a comprehensive report and provide recommendations that are specific to your organization’s needs. You’ll have a roadmap and action plan for bringing your database up to standards. As your industry partners, we’re here to help at every step along the way to ensure your ongoing success.
Not sure you want to tackle that on your own? Contact IVC Technologies.