Two Minute Tips
Spectrum Resolution Effect in Vibration Analysis
When performing vibration analysis, understanding spectral resolution is very important. It directly influences our ability to identify and diagnose machinery faults. Here are the key points:
1. Spectral Resolution:
○ Spectral resolution refers to the ability to distinguish between adjacent
frequencies in a vibration spectrum.
○ It determines how finely we can dissect the frequency domain to pinpoint
specific vibration components.
2. Frequency Resolution Formula:
○ The frequency resolution (Δf) is inversely proportional to the total
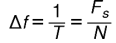
○ acquisition time (T) and is given by: where:
■ (Fs) is the sample rate of the raw waveform.
■ (N) is the number of samples in the signal.
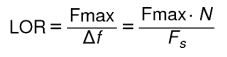
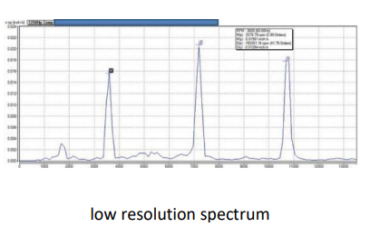
3. Lines of Resolution (LOR):
○ LOR represents the number of frequency bins or lines in the spectrum.
○ Higher LOR provides better resolution, allowing us to distinguish closely
spaced peaks.
○ LOR is calculated as:
4. Practical Considerations:
○ Collecting data with sufficient resolution is essential.
○ A balance must struck between capturing high-frequency details and avoiding
excessive noise.
○ Too few lines may miss critical information, while too many lines can lead to
longer acquisition times.
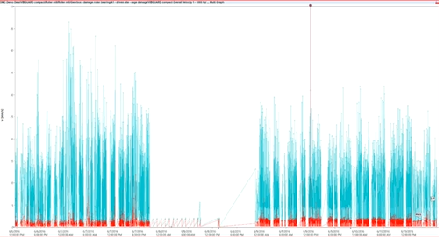
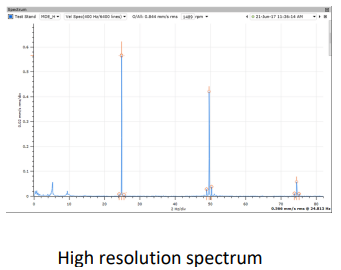
5. Example:
○ Suppose we collect a spectrum with an Fmax of 1,600 Hz and 800 lines of
resolution.
○ The resolution on our plot will be 1,600 / 800 = 2 Hz.
Remember, accurate vibration analysis relies on obtaining data with the right balance of
frequency coverage and resolution.
You may also like...