Wherever you run the predictive maintenance program, whether in a chemical plant or in a hospital facility, there may always be tons of data filling into the databases. Therefore, it is important to visualize the quality data for the analyst in order to make the correct evaluations.
Alarm filtering is one of the effective methods to visualize the quality data.
The purpose of the function is to hide erratic reading and avoid false alarms generated by disturbance from surrounding machine parts or signal generated by the manufacturing process. Some of the examples could be load shocks, scraping etc.
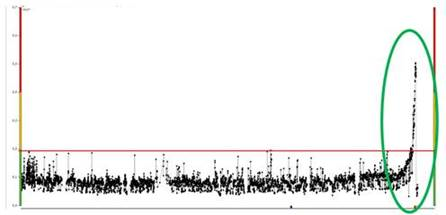
The main idea is to only show quality readings on the user interface for example if the results stay over the alarm level with a predefined number of times. E.g. only show the reading in the graphs if they are over the alarm level 5 times, and once data showed in the graphs also generate an alarm. The readings are not deleted in the data base; therefore, all data is available if needed.
A typical example is drying cylinders bearings. When measuring on those, scraping from doctor blades or high noise from rotating pressure joints can occur sporadically. In order to truly reflect the machinery conditions, it is not advised to make moving averages calculation on such measurements.
In the picture, there are several erratic readings within 6 months that would generate false alarms. When graphical filtering is applied to the mearing results, the whole trend becomes clearer and it can reflect the real machinery conditions. The analyst can easily follow the trend of bearing fault development and make correct actions.
SPM instrument is global leader in condition monitoring technology. We have supplied the world’s industries with high-performance condition monitoring solutions for fifty years, and we are passionate about what we do. Our entire focus is on developing world-class products for world-class reliability and maintenance-that makes us different.
Datong Li is global area sales manager at SPM Instrument, Sweden. In this role, Datong collaborates with the SPM team and regional networks to develop the sales in Russia and Asia pacific countries.
Datong received his master’s degree in electrical engineering from Chalmers University of Technology. He is also a certified vibration analyst CAT II by Mobius Institute.
By using this site you agree to our use of cookies. You are free to manage this via your browser setting at any time. To learn more about how we use the cookies please see our cookies policy.