About the Author
Sensoteq
Sensoteq

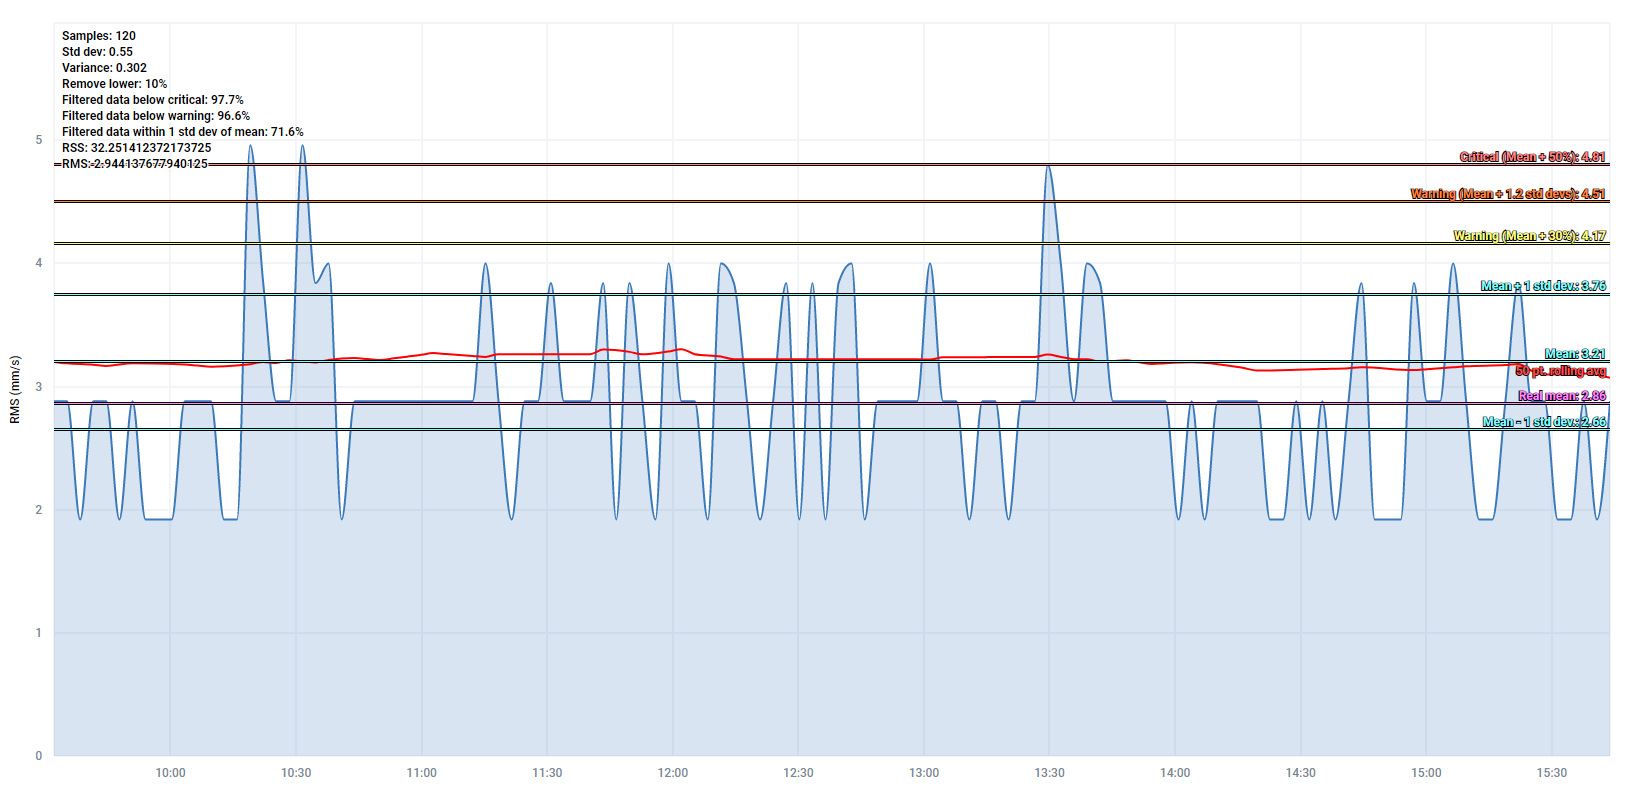 A clean velocity trend with all points below alert and alarm limits.
How do you read this? Well, that depends on who you are and what your position is in your organisation. If you are an area owner and this is one of your critical machines, then you’ll probably be really happy. Readings are being taken and everything looks good. The actual alert and alarm limits, enveloped spectrum alarms, high-frequency detection-that’s all been taken care of by the reliability department.
On the other hand, if you’re a technician and it’s your job to take these readings with a hand-held data collector, this trend can be described with one word – boring. While there is always value in taking a reading on a rotating asset and using your 5 senses to look for issues that might not be picked up with vibration, this only extends so far for machines that rarely have issues. For AHUs with sensors already mounted and cabled to the outside with BNC connections, you’re not even using the 5 senses. The most difficult part of the job is keeping your concentration and matching the asset in the route to the asset you are at. This has to compete with your attention span which might drift to what you’re going to have for dinner tonight or what you might watch on Netflix after. The technicians of today are hungry to learn and want to be as much a part of Industry 4.0 as anybody else. They will naturally gravitate to work that is interesting and challenges their grey matter. Taking readings on AHUs does not do this, especially if they are not involved in the analysis.
So, if you already have sensors on your AHUs, why not go the extra mile and stick a transmitter on the outside and send all that data up to the cloud. The reliability team are then not limited to one reading a month to figure out what’s actually going on. If you have your sensors on process equipment, then you can not only look at data related to machinery diagnostics, you can use export your overall trend into a data analytics package and overlay vibration against pressure, tank levels, valve states, flow rates. Maybe your pump is dead-heading against a manual valve that has no feed-back. Maybe it’s pumping against a partially closed control valve that is choking flow so the system can come up to temperature. This would then result in increased axial vibration, possibly over the alarm limits, that would then prompt an analyst to recommend a pump check, focusing on the coupling. In reality, this will be a temporary rise in vibration and by the time the technician gets there, will probably be passed. Maybe it’s being fed from a tank and the low-level interlocks aren’t working so it’s cavitating. Take it one step further and you can look at flow-induced vibration from where the system curve intersects the flow curve for different flow rates. A whole new world opens up.
To do this, you’ll need to think of systems as opposed to just individual assets. P&IDs, dampers, control valves, tank levels, flow rates-all the information from this instrumentation will form part of your assessment as opposed to just drive end and non-drive end vibration. This scenario is coming to an organisation near you, whether you like it or not. You just have to decide if you want to be a part of it.