There are a lot of equipment types in the industry that exhibit continuously varying speed. This presents a number of challenges to the vibration analyst. If a time sample is collected as the machine is continuously changing speed, the FFT will produce a virtually useless plot.
There are numerous types of machines that have continuously varying speeds. Many speed up for minutes and then slow down at the same rate. Winders on a paper machine constantly vary their speed. Bucket wheel excavators have a lot of machinery on them that is always speeding up and slowing down. Electric shovels, crane systems for ships, haul trucks, and wind turbines are also examples of continuously varying speed machinery.
How Does One Capture and Trend a Continuously Changing Event?
We can use several strategies to gather data from machines that constantly change speeds.
“Quick Draw McGraw”
- Data trending of overall values, no tachometer
- Order tracking spectrums
- Quick Draw McGraw
One tactic of capturing data on varying speed machinery is to be “quick on the draw”: take the reading fast and with some luck. If you are too slow or take the reading at the wrong time, you will end up with a smeared or skewed spectrum with no identifiable frequency or RPM. The amplitudes will falsely indicate low.
Trending w/ No Tachometer
Another strategy is a data trending technique that was used on the wire saws. Even though no tachometer is used, it is still possible to capture meaningful data by tracking readings. Because of the control system of the saw, they had no idea of the RPM it was turning and no feedback mechanism for it. Using a laser tachometer was out of the question for two reasons: the owners of the machine did not want to risk contamination and glycol solution was flying everywhere.
With this technique, try to capture lots of overall data over a long time period. In the case of the wire saw, eight hours were captured. If there is enough data, you will get a trend effect.
The disadvantage of this technique is that you cannot use a hand-held data collector because of the time it will take. An online system is ideal here.
Keep in mind that you are collecting overall data, not spectrums. Use peak hold to capture maximum amplitudes. Apply measurements in different units. For example, do some type of filtering by taking acceleration for high-frequency bearing indication and doing velocity for more mechanical faults that show up over time.
How Does One Capture Meaningful Spectrums During Speed Changes?
A spectrum is necessary to see gear mesh and bearing faults. This is where order tracking can be critical to producing a useful spectrum with precise, identifiable peaks. While not exactly the same as time synchronous averaging, order tracking is different. Using this technique, the tachometer enables the time waveform to be adjusted as the speed of the machine changes. Not only does that allow us to see clean orders of running speed, we also see other consistent frequencies; both synchronous and non-synchronous.
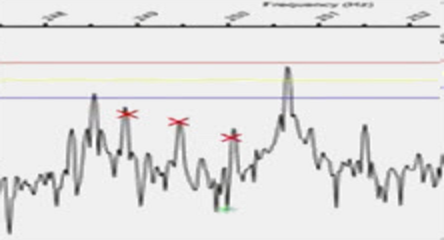
In the images below, the differences are clear. In the image on the left, the spectrum domain is CPM and the time domain is in seconds. In the image on the right, the spectrum domain is orders and the time domain is in revolutions. The spectrum on the left is useless, a massive smear of different frequencies recorded at different moments in the time sample. The spectrum on the right is clean and relatively straightforward to begin to analyze.
With variable speed machines becoming more and more widespread, additional tools are required to effectively monitor and accurately diagnose problems. Order tracking is one of those tools. While it may require a bit more setup time in the field, the results of the analysis end will more than justify the time.


Interesting subject. Faults under transient conditions can also be detected using the spectrogram (Waterfall plot) , no ?
Can you share the figures ?