Two Minute Tips  

Key Features for a Vibration Analyst

Alan McCall | Chief Technical Officer, Sensoteq

When monitoring the vibration data of a machine, an analyst will want to look at the Time Waveform (TWF) and the Frequency Spectrum or FFT (Fast Fourier Transform) output, as shown below.

Example of a Time Waveform (TWF) and Spectrum for a Vibration Analyst

                                                                                                    Example of a TWF and Spectrum

These two example plots are very useful for determining obvious failure modes, such as, an imbalance with a high amplitude value of Overall (OA) Velocity in the 1 X RPM band or a slippage between two components causing amplitude modulations or beat frequencies visible in the TWF.

For more complex analysis, analysts require further tools to diagnose better the issues. Playing the TWF as an audio file is a good way of listening to the vibration to potentially hear knocking, pinging or high frequency whistling, denoting a problem to further diagnose, as if you were actually beside the machine.

Time Waveform (TWF) being played as an audio file


                                                                                            TWF being played as an audio file

Auto-correlation and circular plots are two other useful techniques applicable to the TWF. Auto-correlation can be useful to remove noisy signals and determining the periodicity or repeating patterns in the vibration signal. The TWF below shows this before and after auto-correlation is applied.

Before auto-correlation  | Sensoteq

Before auto-correlation          After auto-correlation by Alan McCall

                                                                     After auto-correlation

Finally, an additional step to visualise this better is to perform a circular plot. In the example below the three peaks indicate this application is a pump with three vanes. In this plot view using it can easily determine such failures as a broken fan blade, an imbalance on a vane, or rotor bar issues (if on a motor).

Example Circular Plot | Sensoteq

                                                                                                        Example Circular Plot


So as a vibration analyst make sure you use all the tools available to you in your software platform for ease of your analysis.

Subscribe
Notify of
guest

This site uses Akismet to reduce spam. Learn how your comment data is processed.

3 Comments
Oldest
Newest Most Voted
Inline Feedbacks
View all comments
Rajshekhar Uchil
Rajshekhar Uchil
3 years ago

Fascinating

Nu'man Ahmad Fawzal
Nu'man Ahmad Fawzal
2 years ago

Good article and thanks for sharing

Abdullah Bawazir
Abdullah Bawazir
2 years ago

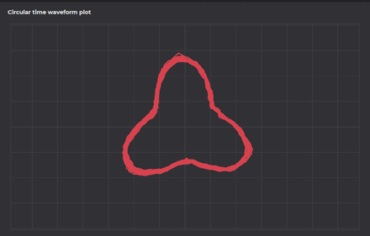
How to set circular plot in skf@ptitute

About the Author

Alan McCall Chief Technical Officer, Sensoteq

Alan is a Chartered Engineer with 20+ years of experience in advanced product design and development. His experience spans analogue and digital design, wireless technologies, embedded systems, firmware, data analysis, complex algorithms and applied physics.

His expertise is in sensor technologies and low power wireless interface electronics. An innovator at heart, resulting in 8 granted patents in unique sensing applications, within industrial, medical and automotive markets. He has a proven track record of creating products from concept to high volume production, whilst developing an innovative technology roadmap. He holds BEng (Hons) in Electronic Systems from University of Ulster.