First Step in AI Based Predictive Maintenance
With the increasing demand of IIoT in the age of digitalization, data-driven maintenance optimization of industrial equipment is one of the most trending topics among maintenance professionals. At the beginning, data gathered by various sensors placed on the machines or embedded in the machine itself are pre-processed. Later on, this data is used for Decision-support systems with Artificial Intelligence (AI) tools. In this article, we will talk about how artificial intelligence applications can be implemented in the predictive maintenance area. At the beginning Predictive Maintenance was just a rule-based system. But it was not even close to solving the problem. In rule-based predictive maintenance; maintenance is performed based on hard-coded thresholds, and an alert is sent if a measurement exceeds the thresholds. E.g; It is rule-based predictive maintenance for a pump to generate an alarm when the vibration RMS value exceeds 7.1 mm/s. This predictive maintenance application is widely used with the help of ready-made ISO standards along with traditional methods. Predictive Maintenance has evolved over time from rule-based predictive maintenance to machine learning-based predictive maintenance. In predictive maintenance based on machine learning; It uses advanced analytics and machine learning techniques to predict when the next failure will occur and pre-maintain accordingly. But this issue is pretty huge. In this article, anomaly detection in rotating machinery, which is one of the first steps to be applied in predictive maintenance based on machine learning, will be emphasized.
Anomaly Detection in Rotating Machinery
A rotating machine such as a pump or fan is going to deteriorate from regular use and will begin to produce what we might call ‘anomalies’. This should not be considered a complete shutdown state, but rather a warning that the machine is not in optimal condition and needs to undergo maintenance. The first tool for detecting these anomalies are sensors. The sensors and sensor outputs used in anomaly detection have a very important place in the anomaly detection performance. Consider sensors with the right capabilities and the features are used. But still there is a risk for the data. If the obtained data from these sensors are not transferred to the model correctly, it can cause unnecessary loss of time and effort with false-positive alarms, and very serious material and moral damages with missed alarms. If there is no historically defective signal and healthy signal labeled data from the machines, supervised learning is not in this equation. In this case, we can train the machine learning model on a training set with only “normal” samples and use a distance measure between the original signal and the predicted signal to trigger an anomaly alarm. But we need to define “normal” and “abnormal” at this stage.
Feature Extraction
Rotating equipment naturally generates vibrations and operates on these vibrations. The aim is to keep these vibrations at acceptable levels to ensure production reliability. Therefore, although various sensors can be used in predictive maintenance applications in rotating equipment, the most basic measurement unit is vibration. At this stage, what information the signals received from the accelerometers contain and the processability of this information into the machine learning model constitute the basic performance parameter in anomaly
detection. Two main features can be extracted from the acceleration signals collected from the accelerometers -features extracted in the time domain and features extracted in the frequency domain-.
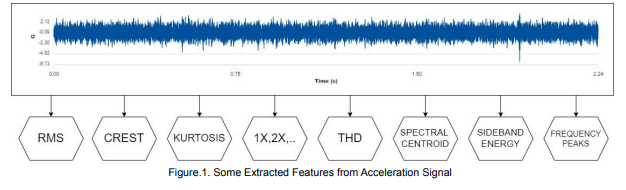
While metrics such as RMS, Crest, Kurtosis, Peak can be obtained from the time domain, features such as total harmonic distortion, 1X,2X,…,10X harmonic indications, spectral centroid and sideband energy are extracted from the frequency domain. At this stage, it is very important to transfer the features in the frequency domain to the model to create a reliable machine learning model. The frequency content is the signature of the normal or abnormal state of that machine. On the other hand, it is equally important to enter the speed information into the model for harmonic analysis independent of the vibration sensor. When we include each frequency amplitude in the frequency domain from a 3-axis vibration sensor to the machine learning model as a feature, it is seen that more than 20000 features are transferred to the model in each measurement, depending on the sensor bandwidth. So here, the machine learning model can compare many features in multidimensional mathematical space better than the human eye can distinguish between data in 2D and 3D space. In this way, even the most sensitive anomalies can be detected according to the resolution of the model.
Machine Mode Analysis
There are hundreds of different machine types that vary according to the usage area in the industry. Many of these
machines operate in cycles, power and processes arising from factors such as constantly changing production speed, raw materials and processes. E.g; A
simple rolling mill will be operated at different speeds depending on the desired material quality, material thickness and production speed. Vibration data from the machine will also vary depending on the speed. In rule-based predictive maintenance
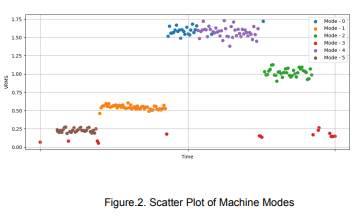
applications, anomaly alarms will occur at every speed change, but this is not true. At this stage, each process parameter (speed, power, etc.) must be included in the model and first of all, the machine modes must be determined. Vibration data were collected at 4 different speeds from a test roller. When these data were inserted into the machine learning model, it was observed that there were 6 different modes. In these modes, 4 of them work at different speeds, and 1 of them is the mode in which the machine does not work. The last mode is the mode in which the anomaly occurs.
If the measurements are not colored in the chart above, we can observe that they are in 5 different groups. However, as can be seen in the graph, the model has 6 different modes. The reason for this is that the machine operating cycle in the cluster, which is divided into 2 groups, is the critical speed for that machine, creating a new abnormal operating mode by creating mechanical looseness in time in the machine assembly and coupling over time as you can see as purple measurements in Figure.2. Although the standard deviation of the data in the cluster, which is divided into 2 groups, is clearly evident compared to the other clusters, it is very difficult to distinguish that there are 2 different modes in that cluster.
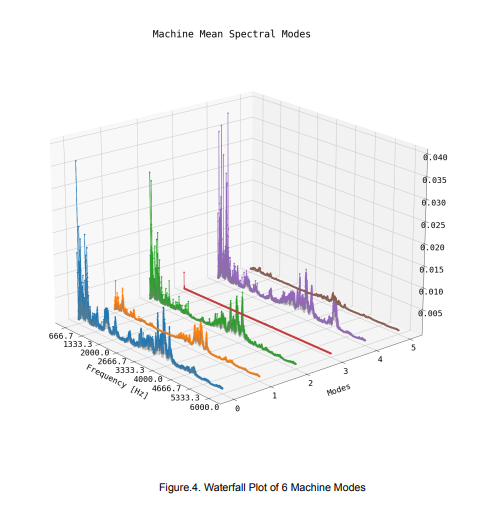
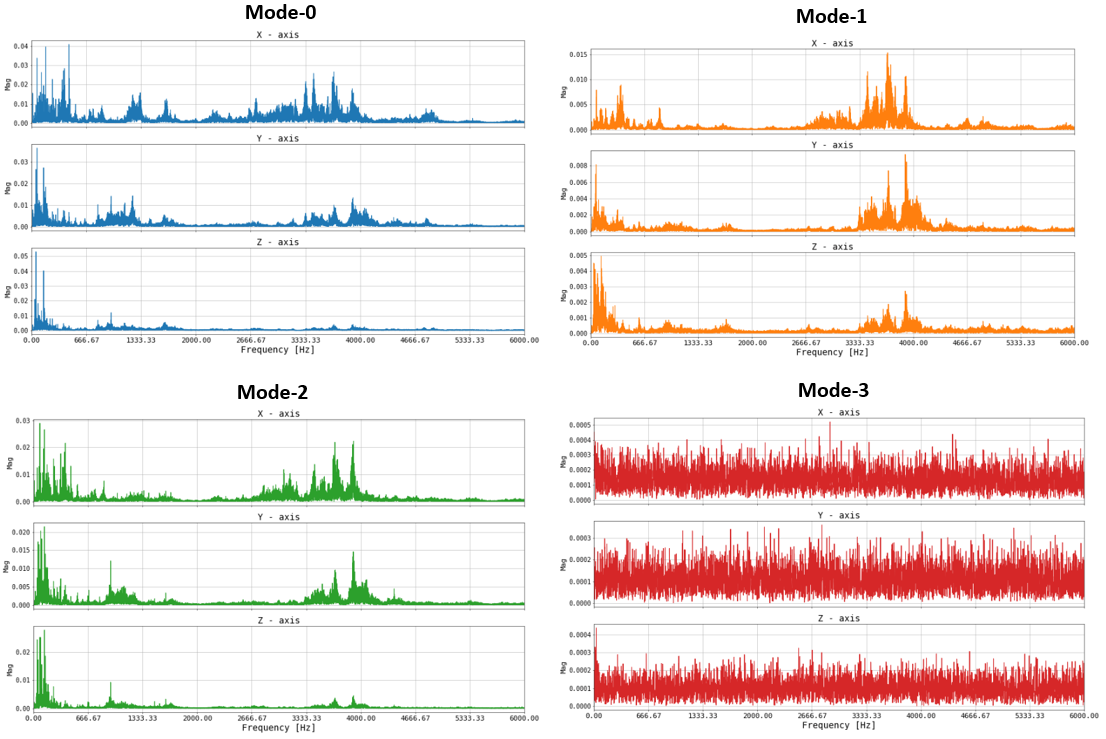
Two measurements operating in the same mode are as above and can be clearly distinguished between blue and purple plot in the spectrum. However, it is very difficult to distinguish these two measurements by looking at the average Vrms values. Of course, another reason for this is that Vrms is insufficient for high frequency vibrations, although it varies from machine to machine, Vrms in some fault types and Grms static alarms in some fault types may be insufficient for anomaly detection. Therefore, transferring all spectral information to the machine learning model ensures optimum results in anomaly detection.
Conclusion
In AI-based predictive maintenance applications, in the absence of historically labeled data, supervised learning is
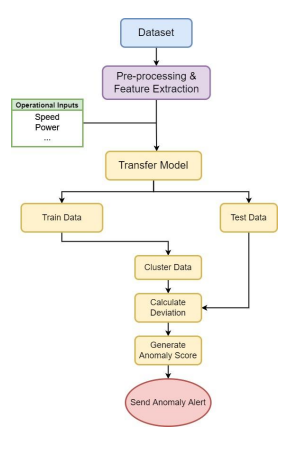 not possible, so anomaly detection using unsupervised learning algorithms will be the best start for the first step. In order to implement this, meaningful features from the data received from the sensors should be included in the models. After the anomaly detections are approved by the maintenance personnel inspection, the semi-supervised learning model can be started by labeling the detected anomalies with their root causes. With the labeling of the data, the root-causes of the anomalies of the equipment can be estimated after the anomaly. Therefore, a generalized AI model based on data is very difficult due to variations such as transmission types and working conditions that change according to industry. For this reason, starting the applications of generalized anomaly detection algorithms using machine-specific transfer learning methods will be the first step in the process. Then, the detected anomalies are labeled by the field workers on the system and root-cause analysis is made. By all these efforts, the first step of the AI-Based Predictive Maintenance journey has been taken.
Co-Author: Basar Gencer, Head of Artificial Intelligence