Today we’ll be looking at another part in our series on the secrets of spectrum analysis: the importance of accurate frequencies. The importance of accurate frequencies simply cannot be overstated. Once we have been triggered by alarms to go in to do an analysis and look at the data we’ve collected, our entire focus shifts to identifying the source, which we do through frequency. Also, through the patterns we see, we are pointed in the direction of various specific faults. And spectrum resolution will also go a long way toward determining how well we can identify those patterns.
We control the accuracy of the frequencies on the spectrum through settings in our database setup and in the box if we’re doing a spot field analysis. The technical term we use for that is spectrum resolution or simply resolution.
Resolution determines two critically important things. Number one, it determines how accurate the frequencies displayed on the spectrum are. In other words, as you move your cursor around from peak to peak, there is always going to be a margin of error related to where the peak is versus where the actual forcing frequency on the machine is. The second thing is how close two or more frequencies can actually come to one another before they simply combine into a single peak, which makes accurate identification of the source of the vibration virtually impossible and often leads to misdiagnoses.
All spectra are made up of a finite number of individual amplitude values, just as a time waveform is. Each individual amplitude value covers a range of frequencies, and these ranges are typically called bins. The actual forcing frequency can fall anywhere within a bin, so the width of that bin is going to determine what that plus-or-minus margin of error is.
There are two independent settings that combine to determine the resolution for every spectrum. They are the Fmax, which is simply the highest frequency that you go to on your spectrum, and the lines of resolution (LOR), which is the number of amplitude values that frequency range will be divided into. Spectrum resolution (SR) equals Fmax over LOR. For those of you familiar with the time waveform, you know that the inverse of that number actually determines the length of the time sample. With time, you always deal with Fmax in Hz; with spectrum resolution, many people prefer to deal with CPM since it gives you a bigger number to work with. Bottom line: as you collect more and more data, you’re getting better and better resolution, but you are taking more and more time in the field.
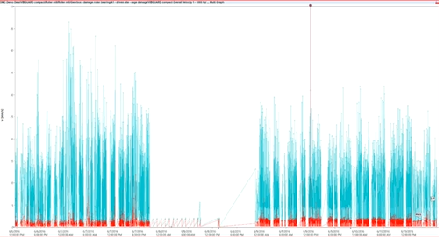
Let’s look at an example. Here we see a spectrum setup with particularly poor resolution: only 400 lines, which no one should be using anymore, and 120,000 Fmax. That gives you a very poor resolution of 300 CPM per LOR or amplitude value; that’s awful, or 5 Hz. The good news is that it’s only going to take you 0.2 seconds to collect it, but if saving time makes your analysis job more difficult, or even impossible, then how good is that time savings now? This is the spectrum (shown in the video) that you would get from that setup, at least in this particular example. This is real data; we have zoomed way in down to 12,000 CPM, so that’s terrible resolution. The large peak is 1X; at least some of it is 1X. But let’s bump up the resolution on the same machine at the same location and see what it looks like.
Now, our resolution is down to 7.5 CPM per line, or 0.125 Hz per line. The bad news is, it takes eight seconds to collect that time sample to create that spectrum. But the good news is, you go from that (previous spectrum) to that (new spectrum). And look at what that peak is actually comprised of: those are pole pass frequency sidebands. And you can see here if you look up at cursor A, 3555 CPM; that is the cursor on the highest peak, which is 1X. So you have a slip frequency or 45 CPM. It is a two-pole motor. Your pole pass frequency is 90 or so, and you can see those sidebands line up perfectly. That is an advanced broken cracked rotor bar situation, so it’s very important to be able to see and diagnose that accurately.
When it comes to frequency, accuracy is king. You want to get to the point where you have good enough resolution to accurately analyze and diagnose whatever faults it is you are looking for. Sometimes you need better resolution than other times, but you always need to have it good enough. Too little resolution means you miss the critical detail and misdiagnose the fault; too much resolution means time wasted in the field with no additional benefit or return on that investment in time. Again, the secret is to find that sweet spot. Sometimes it takes a little looking, and there are tricks to it, but you want to find the place where you have good enough resolution to do proper analysis and go no further.