CASE STUDY: Improve Electro-Mechanical Reliability Using Electrical Signature Analysis – Part I
Electrical Signature Analysis (ESA) is a predictive maintenance (PdM) technology that uses the motor’s supply voltage and operating current to identify existing and developing faults in the entire motor system. These measurements act as transducers, and any disruptions in the motor system cause the motor supply current to vary (or modulate). By analyzing these modulations, it is possible to identify the source of these motor system disruptions. Energized motor testing using ESA will provide valuable information for AC induction and DC motors, generators, wound rotor motors, synchronous motors, and machine tool motors used for PdM testing, commissioning, and troubleshooting.
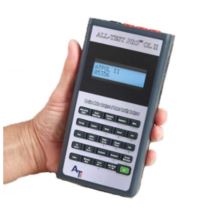
Current and voltage waveforms are collected using the portable, hand-held, battery operated ALL-TEST PRO On-Line II™ (ATPOL II™) ESA instrument, and then via a Fast Fourier analysis, the technician is able to evaluate both the electrical and mechanical condition of the motor system.
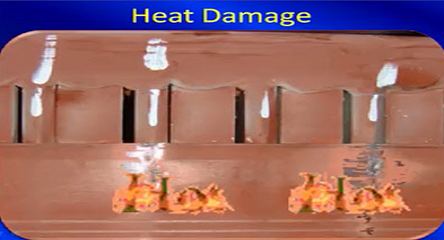
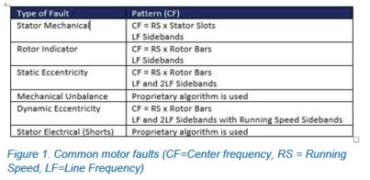
Motor system faults (whether related to incoming power, motor electrical or motor mechanical, mechanical coupling or the driven load) all will have unique signatures when using ESA techniques (see Figure 1). Therefore, with information about the motor and motor system, relevant fault frequencies are identified, and the entire system can be evaluated.
Numerous indications of performance are revealed within the time and frequency domains that provide the required information to determine the ‘health’ of the motor and the impact of the delivered load. This permits actually ‘seeing’ the true running speed, motor slip frequency, gear mesh frequency, drive train components, and gear rotational speeds.
Fast Fourier Transforms (FFT) are used to create both high and low-frequency spectra. The peaks in these spectra correspond to the rotational speeds of the different components in the machine. For example, in the case of a fan driven by an electric motor through a belt, the peaks correspond to the motor speed, pole passing frequency, fan speed, and belt speed. If a gear box is used instead of a belt drive, then spectral peaks will appear at the rotational speed of the gears and gear meshing frequencies.
Energized motor testing using ESA will provide valuable information.
Performing Electrical Signature Analysis
Nameplate data is not required during the data collection process, but automatic analysis can be performed by entering motor nameplate voltage, running speed, rated power and full load current during the analysis process. Common mechanical system faults between the motor and load due to wear and application include belt or direct drive misalignment, belt or insert wear, belt tension issues, and sheave wear. The load can have numerous types of faults depending upon the type of load. The most common are worn parts (i.e., seals), broken components (gears, fan, impeller blades, etc.), and bearings.
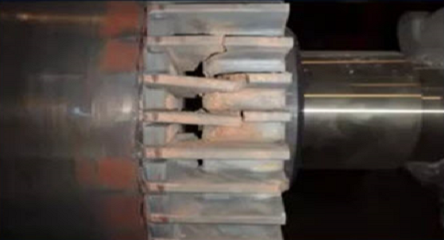
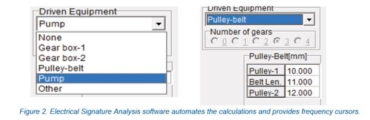
The ESA software allows the technician to enter information about the mechanical system (see Figure 2), and then relevant frequencies are automatically calculated (the software provides cursors for locating these frequencies within the spectra). Driven equipment analysis includes belted, geared, and bladed equipment. Please note that mechanical system information is not required for motor electrical and mechanical analysis and is only relevant when there is a need to analyze the mechanical load.
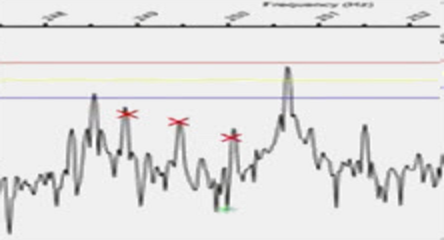
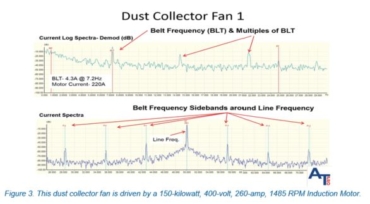
As an example, let’s look at the low-frequency data from a Dust Collector Fan 1 that is driven by a 150-kilowatt, 400-volt, 260-amp, 1485-RPM induction motor (see Figure 3). Notice the Peak labeled BLT – this is the belt frequency, or speed of the belt. There are multiples of the BLT, which are shown in both spectra. The lower spectra show the Line Frequency Peak and that there are sidebands on either side of the Line Frequency that are at the BLT frequency. The fact that belt frequencies are present, especially at 4.3 Amps, is significant. Sidebands are evaluated by the fact that they are present. Also, multiples of the belt frequency; therefore, I suspect some issue(s) with this collector. However, the technician that collected this data and performed the initial analysis choose to monitor this machine versus perform further inspection or testing.
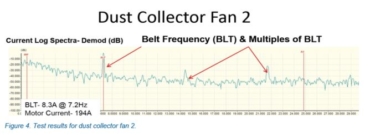
A sister machine, Dust Collector Fan 2, was also tested. In figure 4, notice that the motor load is lower than Fan 1 (194A vs. 220A), yet the BLT peak is at 8.3A, whereas Fan 1 had a peak of only 4.3A. From this initial test, we cannot conclude that this is a serious problem, but instead this is a warning flag that something is different about this machine compared to the first.
As this data was taken during the detection phase of the PdM work process, the next step is to start the analysis phase. As part of the analysis phase, the technician made a quick visual inspection of both machines and noted that the belt of Fan 2 has excessive belt movement compared to Fan 1. The next step is to do some additional work which may include taking additional data with ESA or bringing in other instruments as part of the analysis phase.
Conclusion
The electric motor makes an excellent transducer when using Electrical Signature Analysis, as you can evaluate incoming power, the electrical and mechanical condition of the motor, and the driven load. When it comes to power quality, controls, stator and rotor condition, air gaps, bearings, alignment, and load, a developing fault can be detected and trended for Predictive Maintenance purposes – but you must first have the right equipment to perform Electrical Signature Analysis.
This application story is part one of a three-part series about using ESA for assessing the condition of motor driven mechanical systems.
For more information, visit www.alltestpro.com.