We can use vibration analysis to see what goes on in the interface between moving surfaces and, therefore, catch potential problems there. To do this, we need to look at data most analysts skip over. A lot of analysts let the analyzer decimate their data, throwing 90–99% of the data out and looking at only the remaining 1–10%. Instead of allowing your analyzer to do this, you should look at the data yourself and intelligently decimate it.
Shear Force
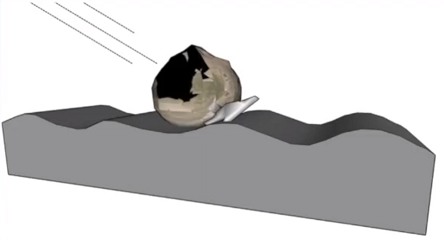
“Shear” refers to the movement of one surface over another—this is why scissors are called shears—and friction is the surface resistance to that movement.
John Googin, the chief scientist of Y12, was once asked how composite structures fail in compression. He replied, “Nothing fails in compression. If you think you have a compression failure, look again. It’s probably shear.”
This is true. Compression is a load mechanism by which machines perform their work. If you look at bearings and gears, the surfaces contact each other in compression and shear. The compression is not a problem. Shear can be a problem when there is stick-slip friction, impacting, metal-to-metal contact (due to insufficient lubrication), and severe sliding.
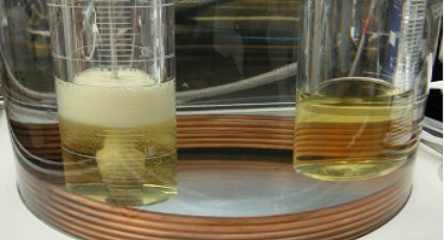
In contrast, compression is positive when there is a lubricant film to separate the two surfaces.
Tribology
Tribology is the study of friction, wear, and lubrication. Friction is resistance to movement. Static friction is called stick, and dynamic friction is called slip. In rotating machinery, the “stick” variety of friction is necessary, while the “slip” should happen in compressors and reciprocating engines.
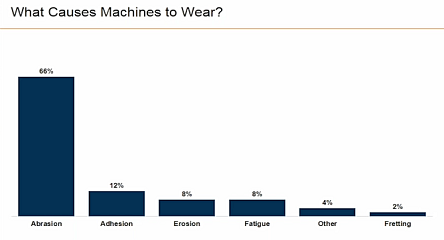
There are a number of shear-related mechanisms that can cause a machine to fail.
Adhesion: severe sliding contact between surfaces
Abrasion: particles in the lubricant that cut up the machine from the inside
Fatigue: sub-surface cracking that occurs with shear
Corrosion: destruction of metals through chemical reactions (environmental factors)
Cavitation: vacuum pockets in fluid that implode
Electrical Discharge: current finding its way to ground
Deposition: molecules settling outside their solution
Just as friction can be strong or weak, lubrication can be strong or weak. Lubrication is very strong in carrying compression, but it can be a weak link in anti-friction bearings, in which the lubricant film provides a nearly frictionless interface between the roller and the race.
Shear is machine movement. The surfaces will try to move across one another but, in most cases, there should not be any actual contact between them due to lubrication. If contact is occurring, failure will not be far behind.
Causes of Failing Lubricant Film Strength
Three major types of lubrication are hydrodynamic, hydrostatic, and elastohydrodynamic.
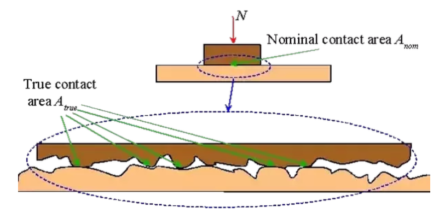
Two pieces are generally loaded metal-to-metal, but not touching because there is a lubricant film between that carries the compression without allowing the surfaces to touch. If this system is working well, the machine will have a long life. However, there are many ways it could go wrong and not all of them have to do with bad lubricant.
Slow speed: Just as a skier will sink if the boat is not going fast enough, your machine needs speed to remain properly lubricated. If the machine is working too slowly, or the lubricant is flowing too slowly, the two surfaces are more likely to touch.
Excess loading: There are a few problems that can cause the load to exceed the capacity of the machine.
Static problems: assembly, fit, press, thermal growth, startup, or break-in
Dynamic problems: process surge, resonating structure, critical resonance during startup, unbalance, misalignment, soft foot, or other looseness
Lubricant system: The lubricant may not be reaching all parts of the machine at all times. This can happen for many reasons, including cold, plugging, varnish, or pump failure. Foaming can also cause lubricant issues.
Grease problems: Inadequate lubrication can also be caused by over greasing, under greasing, using the wrong grease, or mixing incompatible types of grease.
Oil problems: The machine may have low or no oil, or the wrong viscosity grade for the operating temperature. There could be entrained gas or liquid, or critical additives could be missing or depleted.
Hidden problems: These include defects, accidents, oversights, and mistakes.
Wouldn’t it be nice if we could use our traditional vibration programs to see these problems when and where they are occurring and identify the root cause?
Everyone’s vibration analyzer is collecting this data. Modern analyzers hold more data than we need, and we usually throw 98% of it away. Some of the data that is discarded is important. Instead of allowing your analyzer to decimate the data, practice “intelligent decimation.”
Oil analysis and vibration analysis are both proactive and predictive. By showing you a problem, such as contamination or misalignment, before damage occurs, these programs allow you to be proactive and fix the problems. Both are predictive as well since they each allow you to follow the stages of a problem, such as particles and cracks, and predict when failure will occur.
When looking for stress waves, most analysts either look for the high (ultrasonic) frequencies above 20 kHz or the low (sonic) frequencies below 10 kHz. Demodulation, Shock Pulse®, Peakvue®, gSE®, and Enveloping are all examples of this lower frequency technique. Very few analysts, however, look at both together, so they can miss important data.
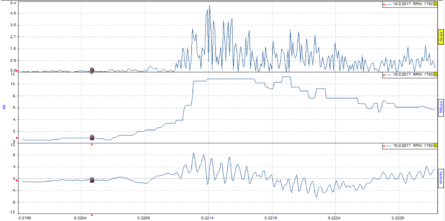
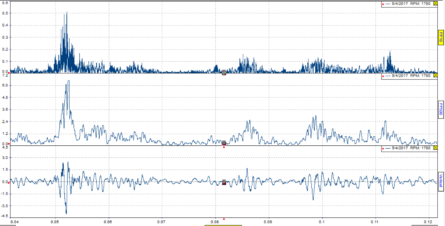
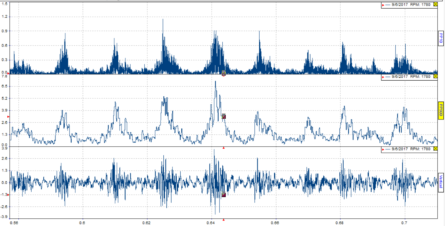
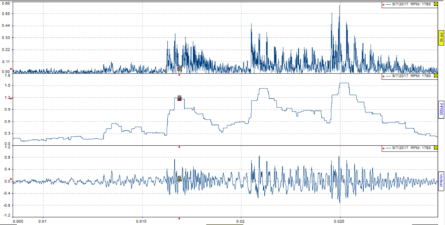
The term Jerk, as an engineering term, is defined as the rate of change of acceleration. It can be measured as a peak to peak amplitude, a signal detection term familiar to all vibration analysts. The first two charts below are labeled to designate the length of time the pk-pk is being measured. PP10 means the measured peak to peak value in 10 msecs (0.010 secs) and PP500 means the measured peak to peak value in 500 msecs (0.500 secs).
PP10, on the other hand, reflects interactions as the boundaries slide across one another (slip contact). This is very different from the PP500 since no structure or mass can move as quickly as what we see in the PP10 plot. The two surfaces are touching one another, the asperities are colliding, and the effects of friction or turbulence appear in PP10.
Intelligent decimation that starts with our oversampled data can be compared to how a security camera works. While the camera is always “on,” it often will be set up to only store data when an anomaly occurs (i.e, a person in the camera’s field of vision). With our oversampled data, any abrupt change will “flag” the PP10 data, marking the precise time the change took place and keeping the data immediately surrounding the event.
It is true that 100+ kHz data is too much to manage and we have to throw much of it away, but only after looking at it and deciding what is important. The first step is to find out what parts of the data are interesting and what parts are not: this is similar to the way a security guard might find pertinent segments or frames from surveillance video: flag an abrupt change because it indicates a causal event. Between flags, we report five measurements, or segments.
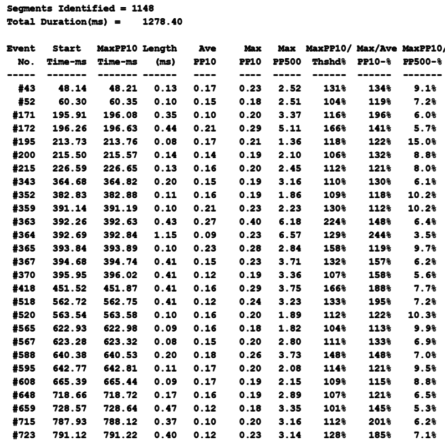
The above chart was compiled from 131,849 data samples collected at the 102.4 kHz sampling rate. In that time, 1,148 segments were flagged for an anomaly, with each event being made up of 5 data bits, resulting in around 95% decimation:
1 – 1148 x 5/131,849 = 95.6%
We keep the statistics and the “problem” events and get rid of around 95% of the data.
Interpreting Segment Parameters
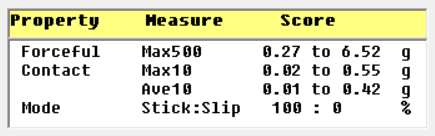
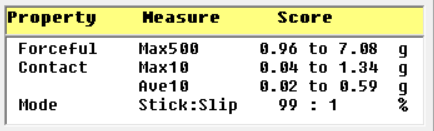
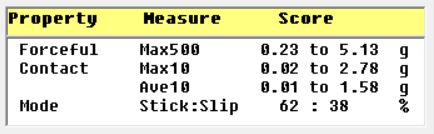
Forceful acceleration: PP500 measures forceful dynamic loading, impacts, and severe sliding contact.
Metal-to-metal contact: PP10 reveals metal-to-metal contact. Exaggerated PP10 is evidence of slip contact, rubbing contact, boundary, or mixed-mode lubrication with a hard metal surface.
Threshold: Sorted PP10 and PP500 data automatically establish or validate statistical limits.
Stick-slip: Proportional comparisons of PP10 and PP500 precisely locate time and magnitude for sticks and slips.
Pervasive: Average scores reveal the pervasive or selective nature of damaging motions and contacts.
Variance: Max scores divided by either average scores or by threshold limits is a report of scatter, like standard deviation.
This bearing has 6.52 g of acceleration due to the movement of components, but the slip value is zero. The ratio of PP10 and PP500 is low. The wave form shows high forcefulness, which could indicate a serious problem, but the fact that there is zero slip is an encouragement that there is nothing unusual happening in the ball bearing.
A slip of 1% or 2% in a roller bearing raises a red flag. That means that there are catch-ups occurring within the bearing. Each of these impacts have a high-frequency content where the ratio between the PP10 and the PP500 indicates that there is collision and sliding taking place. It is not serious yet, but it’s not the typical rolling contact.
In this example, we see high-impact loading (5.13 G’s) along with a very high slip of 38%, which is embedded in every impact event (stick . . . slip . . . stick . . . slip . . . etc).
Note: Additional examples are covered in the full presentation.
Summary
Shear force is the mechanism through which industrial machinery gets chewed up, its life greatly diminished. Compression force is what load-bearing surfaces are designed and built to carry, so while it is still a concern, it is nowhere near the problem that shear force can be. Subsurface shear leads to fatigue, and interfacial shear causes increased friction, boundary contact, severe sliding, and adhesion.
Although it takes some practice and understanding, a vibration analyzer can be used to detect and quantify shear forces using the PP10 and PP500 techniques explained here.
Ray is a reliability consultant and inventor named on patents associated with machine condition monitoring with oil, infrared, and vibration analysis. Ray received his BS Degree from West Point and MS degree from the University of Tennessee. His professional certifications have included Professional Engineer (PE), Certified Lubrication Specialist (CLS), Certified Reliability Leader (CRL) and US Army Engineer (LTC).
By using this site you agree to our use of cookies. You are free to manage this via your browser setting at any time. To learn more about how we use the cookies please see our cookies policy.