Dashboards are a great way to present data effectively. They can display an overview of your plant’s current condition monitoring status as well as historical data.
A dashboard can meet specific needs, such as to display data for a particular application, e.g., a hoist, fan, machine tool, rotary calciner, conveyor, or any other critical piece of equipment. Or it can visualize process data, enabling operators to act on changes quickly.
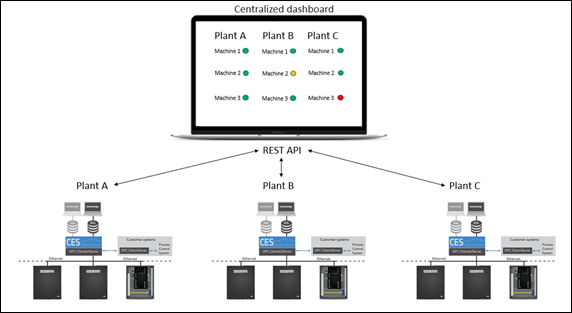
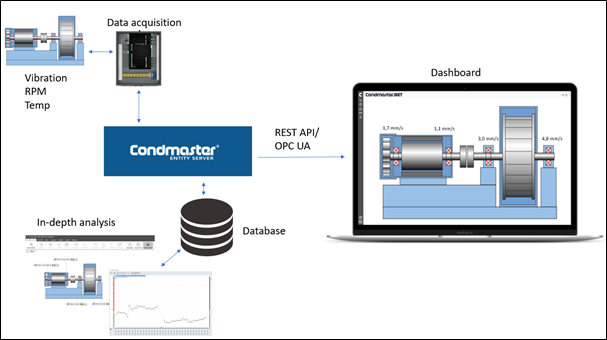
Below is a picture briefly displaying how it works. First, we have a traditional vibration system with a measuring unit storing data in a database. In addition, the server that handles the data communication must be able to handle the REST API and/or the OPC UA protocol.
There are many different data protocols. In this case, REST API and/or OPC UA is used and here follows a brief explanation of the two.
REST API
API stands for “Application Programming Interface”. It is an interface that allows two applications to interact with each other. For example, when you use Facebook on your mobile, an API is used for communication between the app and the Facebook server.
REST stands for “Representational State Transfer”. It is a software architectural style.
REST API is a software style for two applications to communicate with each other.
REST APIs are widely used, mainly because they are simple to implement and use. It is fast and efficient and therefore it is perfect to use when handling big data sets. And you can also retrieve all data in a database.
OPC UA
OPC Unified Architecture OPC UA is a vendor-independent, open standard that specifies information exchange for industrial communication. The OPC standards are developed and maintained by the OPC Foundation (www. opcfoundation.com), and based on client/server technology. OPC UA enables export and import of measurement and other data, e.g. to or from a PLC or SCADA system. For export you need an OPC client, and for import of data an OPC server is required to supply the input data. The OPC client can receive data upon request, or subscribe to data items.
When to use REST API and OPC UA
It is already common today to import data, such as RPM values, with OPC UA. Process parameters are also commonly imported. Although entirely possible with OPC UA, exporting values from condition monitoring systems is not yet as common.
With REST API, you can do the same things as with OPC UA, but there are also additional possibilities such as importing:
- Live data
- Processed data and Analytics Engine data
- All OPC UA scalar values + time signals, FFT, phase, alarm levels, and more.
- Historical data
- REST API is well known to most developers and opens many possibilities for visualizing data within the condition monitoring system.
The example below shows that it is possible to use a centralized dashboard to show data from different plants. The factories can even be located in different parts of the world.
REST API opens new possibilities for sharing data from condition monitoring systems.