Today I’d like to talk to you about statistical alarms for vibration monitoring. This is part of a series of short presentations on setting alarms on vibration data.
One of the important reasons to set alarms in a vibration monitoring program or condition-based maintenance program is for efficiency. Alarms tell us which assets to focus on. Most of the machines in a plant don’t have any problems. We’re taking data on them every month whether they have problems or not, and if they don’t have problems, ideally, we won’t take any time looking at the data. If we have alarms set well, and if we’re confident that our alarms are set correctly and the machine is not in alarm, then we don’t have to look at the data.
Due to something called the 80/20 rule, in a typical plant, 80% of the assets are okay, and only 20% have problems. And if we’re looking at, say, 500 or 1000 machines per month, if we only have to look at 20% of them, that’s quite a bit of time saved.
When it comes to setting alarms, statistics are really about telling us how something has deviated from what is “normal.” And that is exactly what we want to know in condition-based maintenance: Is our machine operating like it normally does, or has something changed? So statistics are really perfect for this type of application.
Before we continue, in order for alarms to work, we have to test the machines in the same way every single time. So if I change the speed of a machine, the vibration will change. If I change the load on the machine, the vibration will also change. If I have three machines running near each other, and one month I test with only one of those machines running, and another month I test with all of the machines running, that’s also going to change the vibration. Basically, what we’re trying to say is, if we test the machine exactly the same way from month to month, year after year, and the vibration changes, then we can say that there’s a problem. Not only does this include speed and load, it also means the same test point, the same sensor, the same test setup, etc. Alarms don’t work unless we have good, repeatable data. That’s the starting point.
Just a quick introduction to something called the standard deviation, or sigma: This is a Gaussian distribution and, by definition, things within 1σ would be 68% of the population, and things within 2σ would be 95% of the population. What this is saying is that when we get outside of 2σ, we’re really becoming an outlier. We could really start to say that we’ve strayed pretty far from what’s normal.
So in this area (shown on graph in video), this is 1σ, and that would be considered normal. Even if we’re in this part, within 2σ, we might start to see slight problems or moderate problems. When we get out here, we’re really an outlier, and we can say the machine has problems.
Most vibration software has something called band alarms, and what these do is break a spectrum up into different bands. These bands are typically drawn around some reference data. That reference data can be averaged, and these alarms can be statistically based. That’s a good feature to look for if you’re looking for software: Can band alarms be based on statistics? Or can they be generated around a sampling of data from your machine over some time and a bunch of measurements, all of which you think represent the machine when it’s healthy? If you can take an average of that and add on one or two standard deviations, then you’re really getting at a nice alarm.
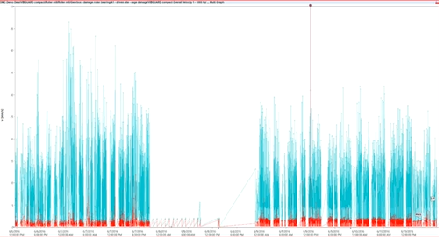
This graph is a statistically generated alarm based on a spectrum. The red graph is a vibration spectrum, and that is actually the result of averaging a number of spectra together and adding on one standard deviation. You can see that the blue spectrum is clearly above that in a lot of different parts. The difference between this alarm and the band alarm is, a vibration spectrum might be made up of 800 or 1600 values if it’s 800 or 1600 lines. A band alarm is just dumbing that down to 6–12 values. We don’t really have to do that anymore because we have these fancy things called computers, so why not set each of these bins as an alarm, each of these 800 numbers? That would make things much more accurate.
Time spent setting alarms is time well spent. It’s a normal part of running a condition monitoring program. The more time you spend making sure your data is good data and making sure your alarms are fine-tuned, the less time you will spend analyzing data. You’ll have fewer false alarms, and you’ll have fewer machines failing without setting the alarms off.