I’d like to talk to you about mask alarms for vibration monitoring. This is one of a series on setting alarms on vibration data.
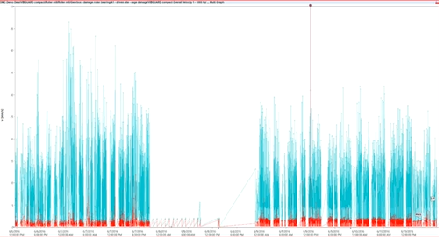
This is a vibration spectrum and, just looking at this, would you say this machine has problems or does not have problems? Before you take time trying to answer, how about now, when I overlay this alarm (alarm shown in red)? Now you can clearly see that this part of the spectrum is in alarm, and you don’t have to think about it. If this alarm was set correctly, perhaps around a baseline or something, and today the vibration is higher, and if we know the data is good data—it was collected under the same conditions: same speed, same load, same test point, same sensor, etc.—then, just looking at this, we can say it’s clearly in alarm. One of the benefits of setting alarms is that, when you’re actually looking at the data, if you have a visual reference on the screen, something that shows what “normal” is, you can clearly see that this is not normal, or this has changed. And that’s what we’re interested in when we’re doing condition based maintenance.
This is an example of an exception report. Let’s say we went around and did a route once a month and we tested 500 or 1,000 machines. Then, we come back to our computer and upload all the data, and our software should tell us which machines are in alarm. This can really help with efficiency. In a typical plant, there’s something called the 80/20 rule, and this says that 80% of our assets are okay and only 20% have problems. The real benefit of setting alarms for condition monitoring is that they tell us which machines have problems so that we don’t have to spend tons of time analyzing all the data from the ones that are not having problems, and are not in alarm.
When you set a mask alarm—usually your software will have a feature to help you do this—you set a minimum level and a maximum level, or perhaps some amount above the spectrum, if you’re using a reference spectrum, and then the width of the mask. Here’s an example of a mask alarm, and it was drawn around this spectrum. It looks like the amplitude of the alarm is about 50% above the peaks, and then there’s some minimum level here. This is a fixed width, meaning that side to side it’s the same width around each of these peaks. This can cause a problem if our speed changes a little bit the next time we test the machine. In this case it looks like the machine is going a bit slower, and so this peak has moved out of the alarm to the left, and this one looks like it’s about to move out of the alarm to the left also. So that would be a false alarm.
We try to test the machines under the same conditions all the time, but realistically a change of five or ten percent is not a problem. Now, if we are in frequency here, if this peak were to move over 5 rpm, and this is 16 times that peak, this would move over 16 times 5 rpm. So a little change in speed there results in a big movement there. One way to deal with this is, we can make our bands wider as we go higher in frequency to compensate for these little changes in speed. Unfortunately, this also poses a problem. What if this was a vane pass frequency for a pump, and the peak marked with the red arrow was a bearing defect? That bearing defect will never raise enough in amplitude to cross that alarm. So that’s a big problem; we’re not sure where those bangs are going to show up, and we want to make sure that our alarms are tight enough so that the bearings will cross the alarm if they do appear.
Another problem with the mask alarm is that it does not detect noise floor increase. This pattern is related to a number of different faults, such as cavitation or turbulence. It could be late-stage bearing wear, and this particular alarm doesn’t pick that up. So that’s one of the lacks of this one.
Going back to the width of the alarm, if your software can automatically order normalize the data, which means it can tell exactly what the running speed is, then it can display the graph in orders. That allows you to get your alarms much tighter so you can reduce your amount of false alarms. Order normalization is a very important feature of software, and you should ask a potential vendor how their software does that before you buy it.
This has just been a short introduction to mask alarms. In other presentations, we will talk about other types of alarms, how to set them, and the pros and cons of each. A message to leave you with is that time spent setting alarms is time well spent. If you feel confident that your alarms are set correctly, you can avoid having to manually analyze lots and lots of data.