Commercial and Industrial Power System Losses and Mitigation through Neutral and Ground
Howard W Penrose, Ph.D., CMRP
President, Motordoc LLC
info@motordoc.com
INTRODUCTION
Even in discussions related to power harmonics most engineers, let alone reliability and energy professionals, understand the potential losses through the system. When it comes to harmonic content in neutral and ground in single and three phase systems, and the related losses, there has been limited attention. This is primarily due to messaging in the 1990s before the dramatic increase in power electronics and other non-linear loads that have a direct impact on energy consumption, operations, and reliability. In this article we will discuss monitoring using an EMPATH ECMS-E1 monitoring device, collaboration with local utilities, and the application of Onics Energy OES-11 neutral and ground passive filters.
As commercial and industrial systems have become more complex non-linear loads are increasingly introducing harmonic currents into neutral and ground systems. The result is: interference related to equipment; latent damage to electrical and electronic systems; improper operation of protective systems; high currents and voltages in neutral and ground systems; increased maintenance costs; and increased energy consumption. There are a number of causes of these currents from unbalanced systems to the use of ground as a reference. For the purposes of this article we will focus on the power losses and where those losses occur, then we will discuss mitigation and monitoring.
Resistive (I2R) Losses
The most commonly understood power loss in electrical systems results from conductor and load resistance known as I2R losses. The power loss is given as P, in watts, equalling the current squared times the resistance of the circuit. Harmonic currents significantly increase these losses due to their squared influence on power loss. When the current is high enough in either a ground or neutral the temperature of the conductors increase and, when high enough, will cause damage. This type of loss is normally measurable but often not the highest loss in the ground or neutral system.
Transformer and Core Loss
Less understood, but having a much larger impact on power consumption than I2R, are the harmonics-introduced losses in the cores of transformers. Neutral and ground harmonics in transformers are more difficult to detect but will add directly to the neutral/ground connection in the transformer winding. The losses include hysteresis and eddy current losses as well as core resonance.
Assuming even a balanced circuit with harmonic content, the three phases of harmonics are added in the neutral. While normally adding to zero, with the addition of harmonics the complex values (phase angles and magnitude) are added as vectors. Depending on the application, if no neutral is present, these would add to ground currents instead. In other cases, voltage and current may be present in both neutral and grounds.
Figure 1: three ground leads at the neutral on the primary at the utility meter of a manufacturing facility.
Skin Effect Losses
High frequency harmonic currents cause a phenomenon known as the ‘skin effect,’ increasing the effective resistance of conductors. The effect is particularly significant for harmonic currents which have higher frequencies than the fundamental frequency. An in-depth analysis of this condition necessitates consideration of the depth of current penetration into the conductor, which is dependent on the frequency of the current and the material properties of the conductor. The higher the associated frequency the less conductor is available to current flow. The result is an additional I2R loss that would have to be determined at each frequency and current value.
Dielectric Losses and Power Factor Correction Capacitors (PFC)
Power factor capacitors can introduce large dielectric losses due to the charging and discharging of parasitic capacitance under AC voltage. The power loss, P, can be calculated as the voltage squared times the angular frequency, times the capacitor value, times the tan delta of the dielectric material. Power factor correction capacitors are impacted by neutral and ground harmonic content in the following ways:
· Overheating and premature failure – when harmonic currents flow through the PFC they cause an increase in reactive power drawn by the capacitor. This leads to overheating and potential failure.
· Resonance – the presence of harmonics can lead to a phenomenon known as resonance in the electrical network, especially whenthe network inductance and PFC capacitance form a reonant circuit at a specific harmonic frequency, often the 5th harmonic. This can cause high oscilatory currents and voltages, causing increased stress on the capacitors and other electrical and electronic systems in the circuit. This resonance will often result in excessive voltage distortion and either failed PFC fuses or capacitor failure as shown in Figure 2.
· Detuning and inefficiency – harmonic currents can cause the PFC capacitors to detune. PFC capacitors are designed to operate at the fundamental frequency (usually 50 or 60 Hz), and the presence of harmonics can shift the effective operating frequency making the PFC system less effective.
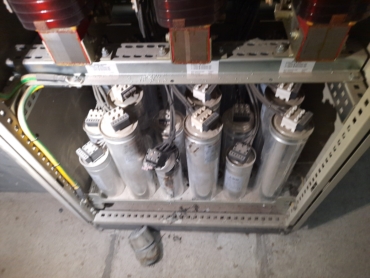
Figure 2: Failed PFC capacitor system due to high harmonics in ground and neutral.
Resonance-Related Issues
While not technically a power loss, resonance caused by harmonic frequencies can lead to overvoltages, increased harmonic distortion, EMI, and equipment damage. The addition of PFC and long cable and conductor runs can exacerbate these conditions due to the potential creation of resonant conditions with the system’s inductance. Resonance will generally also cause high oscillatory currents which lead to additional I2R losses.
CASE STUDY: ELECTRONIC BOARD JOB SHOP
In many applications that have a relatively steady operation or production it is relatively straight forward to determine energy savings. In other cases, such as with industrial job-shops, identifying the impact on energy can be more challenging. In these instances, the base energy consumption and then the energy cost per unit of production becomes even more important. In some cases, the work can be complex enough that data science, machine learning, AI, or the use of advanced energy analysis software tools, are often required. In this case study the data science division of MotorDoc LLC, MotorDocAI.io, was used to evaluate the information provided by the utility and the job shop.
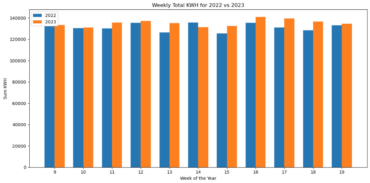
Figure 3: total kWh by week over a direct comparison of 19 weeks over prior year.
Following the installation of the Onics Energy neutral and ground filtering system an evaluation of the utility kWh data was reviewed with the possibility of an increase in energy consumption as shown in Figure 3. The application of data science visualization allowed the evaluation team to identify several conditions that changed the overall evaluation. First, a review of product manufactured and energy intensity of each showed that production had increased dramatically over the prior year. Next, using the production and energy data, it was determined that temperature had a very limited effect on energy consumption providing a tolerance of less than +/- 1% of overall kWh. The differences were still included in the evaluation (Figure 4) in order to provide a conservative energy savings conclusion.
One of the challenges was that the data from the utility was provided in quarter hour increments while the production data was entered as weekly values. Data analysis further identified that the energy consumption and reported production numbers lagged, meaning that the usage increased with low production values and then lower consumption with randomly higher production values. A discussion with the site owner found that while production data was kept by station, the reported numbers were finalized once they went into storage. This resulted in the investigators developing a machine learning process for evaluating and smoothing production data from over two years, including breaking kWh per unit of production by incremental volume and energy intensity. The trained data was then applied to new production and energy information outside of the training data and was found to be within 0.2%. Data from the installed ECMS-E1 system was utilized to identify unusual conditions and events which would impact the analysis. ESA was not used outside of utility data verification, system defect and degradation monitring, and granular data for energy savings. It is common that energy organizations will measure specific in-house applications to monitor before and after consumption. This study has found that it is critically important that this data is collected at the utility meter as well, due to parasitic losses in the system. Local monitoring should only be used for verification and indicators.
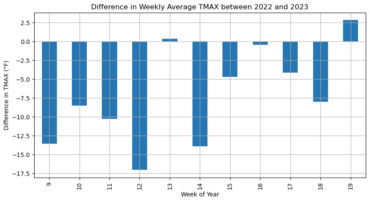
Figure 4: difference in temperature over prior year.
The evaluation was then re-inserted to a 30% testing set (not included in the training data – a 70/30 train-test-split) from prior to the energy modification with the result being less than a kWh per week difference between projected and actual. Base energy consumption was also determined in which further concluded that production energy efficiency increased with increased production. The simple comparison, excluding production volume and per unit of production energy evaluation was about a 2% decrease in prior to present year consumption (kWh). The identification of the increase in volume over prior year showed a dramatic difference with the final energy improvement was found to be 26.8% average at each increment of 5,000 units of production above a minimum number. This was then applied to a forecast based upon the expected increase in production and then compared to new data produced during the evaluation. While demand changes were not discussed in this article, demand also showed a significant improvement.
The data was then presented to the local utility for a potential rebate award. The initial evaluation of simple reduction (present over prior year kWh) qualified for a small rebate. However, following the utility utilizing a third party data science company to verify the data presented by MotorDocAI.io, the final conclusion from the utility was to award the maximum rebate available. At a utility calculated and confirmed reduction of 342 MWh over the next year and a California ratio of 0.276 metric Tonnes CO2 per MWh results in 94.4 Tonnes CO2 per year reduced while improving cost per unit of production.
CONCLUSION
In the 1990s it was thought that the total losses to ground, neutral, and power harmonics would be somewhere in the 2% range, which equaled the known 2% improvement from loose connections, power factor, undersized conductors and transformers, and other electrical conditions. Instead, the number has been increasing dramatically. Numerous other projects of which this article has just two case studies, have found that this number increases exponentially as energy efficient systems and electronic systems are introduced into a facility. Extremely energy intensive organizations such as data centers have also found large improvements.
One of the traditional power system improvements which was found to have a negative effect in modern power systems is power factor correction. The higher the power and neutral/ground harmonic content, the higher the loss values have been found. This also means that when power factor correction is required in a facility, this should be performed in tandem with power, ground and neutral harmonic correction. The result is also the reduction of resonance issues and damage to power factor correction systems.
While this article has focused on an area that has had limited attention, it does identify that power, ground and neutral harmonic losses have a sizeable impact on energy consumption. The ‘loads’ related to these losses produce no useful work and often have a direct impact on the reliability of electrical and electronic equipment. In each case, even simple maintenance tasks such as bulb replacement are reduced. Other observations have found that, in constant load applications, when energy efficient improvements are installed, including variable frequency drives, the actual energy consumption does not decrease, and sometimes increases, until the harmonic conditions are improved.
From an energy calculation standpoint, when looking at steady-state commercial and industrial applications, the energy reduction can be observed directly. In job-shops, variable load production, variable energy intensity systems, and others, the use of energy use per unit of production normalized to variables such as temperature, heating and cooling days, and even base loads and production increments, becomes important. The use of modern tools related to data science is useful for these types of analysis so long as energy, production and waste data is provided. The use of a monitoring device from the sub or utility meter provides granular data that can be used to determine the cause of variations. In this case, the data was also monitored by a MotorDocAI cloud application that used AI to trigger alerts to overall anomalies as an added reliability benefit to the energy project.
REFERENCES
“IEEE Recommended Practice for Establishing Liquid Immersed and Dry-Type Power and Distribution Transformer Capability when Supplying Nonsinusoidal Load Currents,” IEEE Std. C57.110-2018.
“IEEE Standard Definitions for the Measurement of Electric Power Quantities Under Sinusoidal, Nonsinusoidal, Balanced, or Unbalanced Conditions,” IEEE Std. 1459-2000
“IEEE Standard for Harmonic Control in Power Systems,” IEEE Std. 519-2022
H. Aintablian, “The harmonic currents of commercial office buildings due to non-linear electronic equipment,” Southcon/96 Conference Record, Orlando, FL, USA, 1996, pp. 610-615, doi: 10.1109/SOUTHC.1996.535133.
W. H. Kersting, “The computation of neutral and dirt currents and power losses,” IEEE PES Power Systems Conference and Exposition, 2004., New York, NY, USA, 2004, pp. 213-218 vol.1, doi: 10.1109/PSCE.2004.1397573.
M. E. Mahadan, A. F. Abidin, M. A. T. M. Yusoh and M. A. Hairuddin, “Modelling Neutral to Ground Voltage (NTGV) on the Educational Building,” 2022 IEEE International Conference in Power Engineering Application (ICPEA), Shah Alam, Malaysia, 2022, pp. 1-6, doi: 10.1109/ICPEA53519.2022.9744653.
R. M. Ciric, A. Padilha and L. F. Ochoa, “Investigating effects of neutral wire and grounding in distribution systems with faults,” 39th International Universities Power Engineering Conference, 2004. UPEC 2004., Bristol, UK, 2004, pp. 888-892 vol. 1.
Hiranandani, “Calculation of ampacities and sizing of line and neutral conductors in the presence of harmonics,” Proceedings of 1995 Industrial and Commercial Power Systems Conference, San Antonio, TX, USA, 1995, pp. 49-, doi: 10.1109/ICPS.1995.526989.