The Most Effective Diagnostic Weapon in Thermography: Thermal Tuning
You feel good in the industrial field and you now have the opportunity to start work at a high-voltage substation—an important customer requires your consultancy.
Even if your thermal imaging camera is not the best model in the market, you’re confident because you know that it is in any case suitable for the job.
The dealer told you that this model was okay for that kind of inspection, and that you could easily measure the temperature of each component and everything would be under the camera’s control: just point, check the temperature reading and capture your amazing image.
Your simple additional task will be to enter the emissivity value for that material, which can be easily found in a table in the camera menu or in the software.
Very easy, isn’t it?
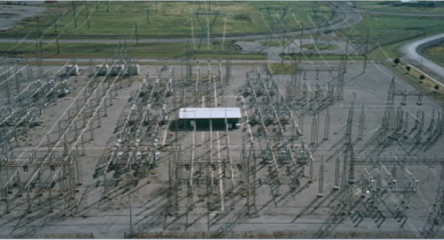
Your first inspection is completely outdoors, on a magnificent evening with clear skies. After about an hour spent watching the various components, you can proudly conclude that everything is fine. After all, you have measured everything and found no anomalies.
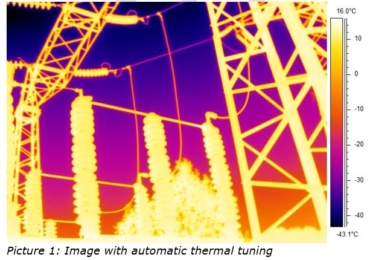
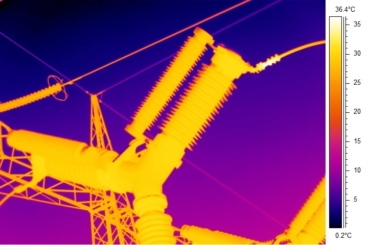
Your images are very nice, like the ones shown below.
After all, you tell yourself, if there was a serious problem I would have seen it…
Satisfied, you know that the customer requires the next inspection in six months and you have no doubt that everything will be fine until that date.
But, after a few months, the customer complains that a problem has occurred—a problem that you may have missed. But you cannot believe it. You were sure…in all your IR images, everything was fine.
Stop! Hold on. Think back… Are you really sure that there is not even a small anomaly in the above image?
Let’s look more closely.
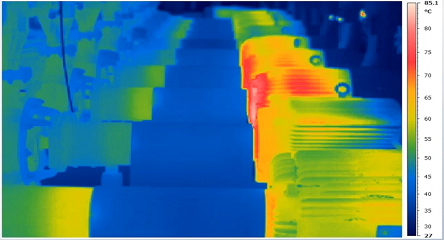
When we took this image, we were using a temperature range of -40°C to 120°C (which is a bit “wider” than normal, although it is not suggested to go outside the limits, to ensure ideal measurement accuracy). This was fine for our survey.
Our IR image has an apparent temperature scale (on the right) ranging from -43.1°C to 16.9°C and all the components we are interested in appear in yellow. In short, we have a beautiful palette of color—dark blue, red, orange and yellow—and we use yellow to show our important components.
But who decided that our image should show the most important components all in yellow instead of blue, purple or red?
The thermal camera decided! And it didn’t ask our opinion. The camera decided on its own that since we were looking at a beautiful view of an electrical substation against a nice, clear evening sky, we should be interested in seeing both the electrical components and the sky.
In reality, we don’t care about the sky. Our magnificent IR camera is cheating us and wasting a lot of colors.
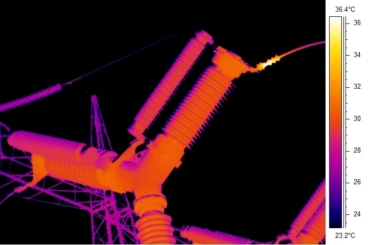
What would happen if, instead, we told the camera to adjust the colors? Let’s see if, by adjusting the controls of our camera or the software, we can change the limits to exclude all the areas of the image that are not relevant to us, focusing all our colors only on what is important to us.
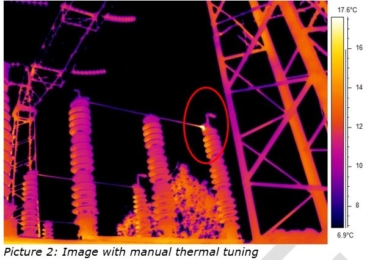
The different color arrangement, now applied to our target, shows an anomaly on one phase of the disconnector due to an excessive play between components. It’s a small thing but, in a few months, this could become a big issue.
But what have we done with our image?
We’ve done an operation called “thermal tuning”: a simple but incredibly effective operation, and probably the most powerful method that a thermographer has to analyze a component and determine the type of anomaly. It’s even more powerful than measuring the temperature of each individual point of our component.
Thermal tuning, in practice, is manually placing the colors available in the camera on the component under examination. This improves the color contrast and, therefore, the visibility of a problem. It is incredibly useful for helping the operator understand better what is going on for each component, and for showing it clearly to the final customer.
Since thermal tuning occurs on the thermographic image, which is derived directly from the radiation received by the sensor, thermal tuning does not influence the calculation of the actual temperature, but simply helps to highlight areas of the image that emit more or less energy (whether it is actually emitted or simply reflected).
This allows us to detect with certainty if something is wrong, even if, not knowing exactly which object parameters are included in our instrument, we may not be able to accurately measure the temperature.
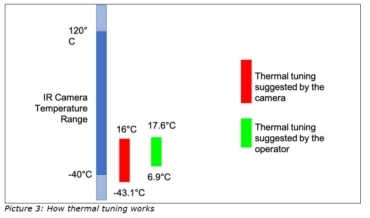
How is thermal tuning performed, in practice?
It’s very simple: Every serious thermal camera and any analysis software allows you to adjust the limits of the scale by setting the maximum or minimum values of the apparent temperature range or by controlling the so-called “span” and “level” of the scale, that is, the distance between the maximum and minimum limit (span) and the mean value of this interval (level).
You do not need to look at the values and adjust them accordingly—just see how the image looks with your own eyes.
By adjusting the colors in the camera or in the software, we raise or lower the two limits until we can see almost all colors of the palette on our object. In this way, we will be sure of using all colors on our target, where we really need them.
Remember: Even if you are doing an indoor inspection, thermal tuning is the first and most important analysis technique. Being a “master” will highly increase your ability to find problems and detect the root cause.
But how far can we go with this technique?
It may sometimes be necessary during the analysis to perform a very extreme thermal tuning to better understand what’s going on.
No matter how far we push the limits, thermal tuning is always a reversible operation.
As an example to help us understand the previous problem in our disconnector, we could process the image in the following, more extreme, way and have an even clearer view of the problem.
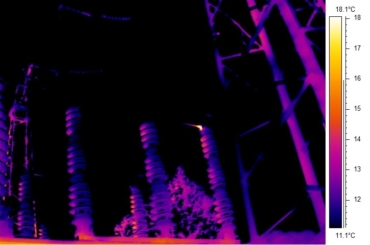
The image obtained would no longer be suitable for showing to a customer, but it would be good for us to better understand the situation.
Once we have carried out the analysis, it will be possible to again arrange the colors as in Picture 2 and deliver that final image to the end customer.
What if we have multiple objects in the same image?
We have two possibilities: Find a thermal tuning suitable for both targets or duplicate the image and adopt two different thermal tunings, one specific to each target.
Is everything clear? Any questions?
If you are still wondering why doing this “visual enhancement” before measuring the temperature of each component is important, think about your life. Before checking the foreheads of all your family members for fever, you first look at their faces to see if anything is wrong.
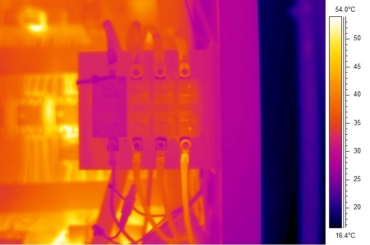
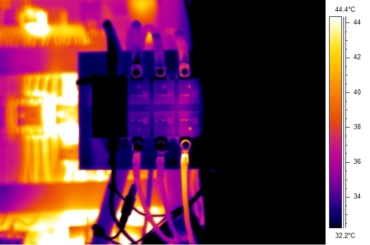
These pictures show images taken before and after thermal tuning.


This is very interesting. Thanks a lot for this job. Bravo.