The purchasing department is always looking for cost reductions to present savings projects to management. Lowering prices is one of the ways to secure these projects, and the search for similar, lower-priced products is indeed an important task for procurement. The problem with this practice is that, specifically when it comes to lubrication, finding truly similar products is not easy at all. There are thousands of lubricant options available, with different combinations of chemical components that can bring either benefits or drawbacks for a given application. As a result, cutting the price of a lubricant in an unplanned way can often mean an increase in hidden costs: of the lubricant itself (when the cheaper product ends up being consumed in greater volumes), of spare parts, of production, or even of energy.
Likewise, many attempts to reduce a company’s environmental impact are reduced to buying biodegradable products or products from renewable sources. These are, of course, important parameters to evaluate; however, believing they are the only ones is a mistake that can lead to a productive process with lower sustainability. A biodegradable oil protects in cases of accidental spills but must go through an end-of-life disposal process just like a mineral-based product. Therefore, to measure the true impact we need a deeper analysis.
Lubricants are not all the same, and a very strong synergy is needed between the purchasing, maintenance, and reliability departments — together with the lubricant supplier — in order to carry out real cost and impact reduction projects.
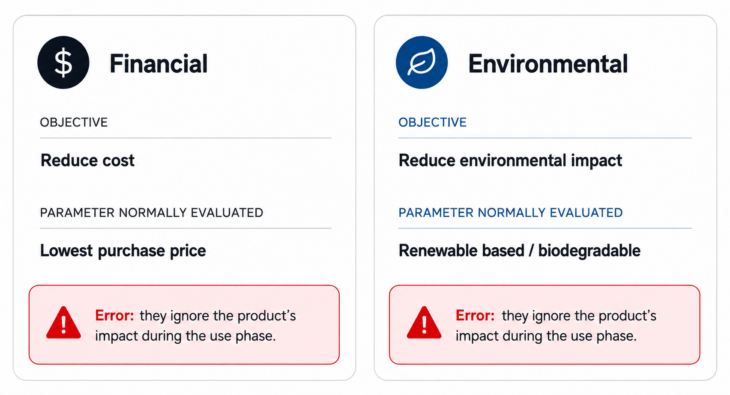
Buying a lubricant based solely on price with the intention of reducing costs is as incorrect as buying it solely because it comes from renewable sources with the intention of reducing environmental impact. Both cases ignore a very important factor for the definition of costs and the true sustainability of a process: the impact of the lubricant during the use phase (Figure 1).
[Figure 1] A very common mistake observed in companies is ignoring the use phase of the product.
In this article we will see that yes, the price per kg or per liter of a lubricant is an important factor in the decision-making process, but not the only one. We will also see that a lubricant derived from renewable sources can indeed help improve process sustainability, provided its performance is considered as part of the overall evaluation. An integrated evaluation structure will be presented for all the impacts (costs, emissions, and intangibles) that a lubricant can have during the use phase.
Industry’s pursuit of sustainability and profitability
Modern industry lives under dual pressure that, just a few decades ago, seemed impossible to reconcile: to produce more and better, with lower costs, but also with less environmental impact. Profitability and sustainability are no longer separate compartments of a strategic plan — they have become two sides of the same indicator. Investors demand ESG reports. Customers ask about the carbon footprint of the products they buy. Governments apply carbon taxes and increasingly strict restrictions on the use of chemical products. And all of this occurs in a market where operating margins are shrinking every quarter.
From an environmental perspective, industry needs a strong change of course. According to NASA (2025), Earth’s average surface temperature in 2024 was the highest since modern records began in 1880, reaching 1.28 °C above the 20th-century average (baseline 1951–1980) and 1.47 °C above the pre-industrial average (1850–1900). The 10 warmest years in the 175-year historical record have all occurred in the last decade (2015–2024). Behind this rising curve there is an established scientific consensus: anthropogenic greenhouse gas emissions — mainly CO₂ and methane — are the dominant driver. This means that any serious industrial mitigation strategy must attack two fronts at the same time: the energy it consumes and the resources it uses (NASA, 2025; NOAA, 2025).
This is where the concept of Resource and Energy Efficiency (REEE) stops being academic terminology and becomes a management tool. REEE refers to the simultaneously efficient use of material and energy resources across the entire productive cycle. It is not the same as “saving energy”; it is an integrated approach that recognizes that every kWh avoided and every kg of material not consumed also represent tonnes of CO₂ that are not emitted.
In an article published in Energy Policy (Ali & Evans, 2025), the authors describe the main decarbonization pathways that will have the greatest impact through 2050. Among them, one of the most important is REEE, which — depending on the scenario analyzed — outperforms the use of hydrogen, electrification, and carbon capture. Out of the 13 million tonnes of CO₂-equivalent that could potentially be reduced by 2050 through REEE, approximately 30% comes from energy efficiency. Finally, tribology can play a significant role in achieving this potential.
In 2015, the UN established 17 Sustainable Development Goals (SDGs), which became the global reference framework for measuring progress toward a sustainable economy. In the study published by Woydt (2021) and in the report Woydt et al. (2021), it was shown that green tribology can impact 6 of the 17 UN Sustainable Development Goals, which are:
#3: Ensure healthy lives and promote well-being for all at all ages.
#7: Ensure access to affordable, reliable, sustainable and modern energy for all.
#8: Promote sustained, inclusive and sustainable economic growth, full and productive employment and decent work for all.
#9: Build resilient infrastructure, promote inclusive and sustainable industrialization and foster innovation.
#12: Ensure sustainable consumption and production patterns.
#13: Take urgent action to combat climate change and its impacts.
The author lists the indicators for each goal and relates them to the contributions of tribology. Many of these contributions are related to lubrication and to energy efficiency (Woydt, 2021; Woydt et al., 2021). It is therefore essential to properly understand the real impact of lubrication on industry, seeking products and services that help reduce the associated emissions. As will be shown, to properly estimate the full footprint — without overlooking any hidden impact — we need to fully understand the life cycle of a tribological solution such as lubricants.
Life cycle of a lubricant
To understand the true economic and environmental impact of a lubricant, it is necessary to broaden the perspective beyond its purchase price and the impact of its production, and to analyze its performance throughout its entire life cycle. Traditionally, much of the attention has been focused on the emissions and costs associated with the lubricant’s raw materials and production. However, several studies show that the use phase may be the most relevant stage, since it is there that the lubricant directly influences component wear, equipment reliability, energy efficiency, and waste generation.
This section presents the main concepts and methodologies used to assess the life cycle of lubricants, as well as the differences between the manufacturer’s and the end-user’s perspectives, with the goal of building an integrated view of the costs, emissions, and impacts associated with lubrication.
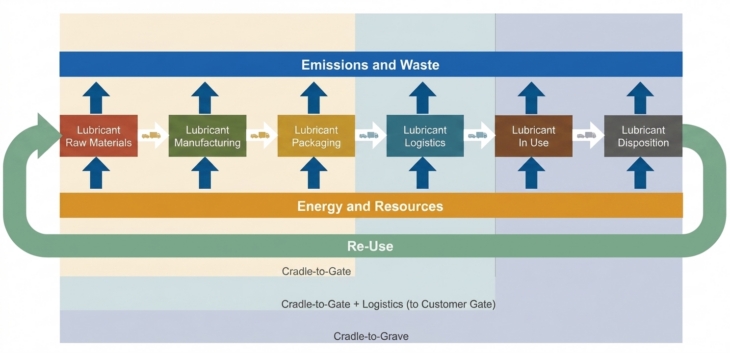
First, we must understand what the stages of a lubricant’s life cycle are. In general terms, any product can be framed within a basic cycle of 5 phases: raw material extraction, production, packaging and transportation, use and maintenance, and recycling or final disposal. It may also be split into 6 parts if the packaging and transportation phase is treated separately. Figure 2 presents a flow of this cycle, along with the main environmental impacts that may be related depending on the product.
The life cycle assessment (LCA) of products and activities, following these stages, is already standardized. Essentially, an LCA is the study of the environmental impact of a raw material, product, or activity throughout its entire useful life. ISO 14040 and ISO 14044 standards provide the principles, framework, and general guidelines that serve as the basis for any LCA study.
Moving further, there are more application-specific standards focused on particular types of impact — for example, greenhouse gas emissions with ISO 14067. This standard is the international norm that establishes the principles, requirements, and guidelines for quantifying and reporting the Carbon Footprint of Products (CFP).
Finally, we reach the standards or guidelines specific to industries or products. Derived from the ISO standards presented above, each industry develops its own guidelines to address more specific details of its products. In the lubrication world, the main ones are: “API TR 1533” (from API) and “Methodology for Product Carbon Footprint Calculations for Lubricants, Greases and other Specialties” (from UEIL and ATIEL). The API TR 1533 technical document provides specific guidance for applying LCA and carbon footprint to lubricant products, promoting methodological consistency in the global industry (API TR 1533, 2023). Complementarily, the European industry — through UEIL and ATIEL — published a certified methodology to calculate the carbon footprint of lubricants, with cradle-to-gate scope and alignment with ISO 14067 (UEIL & ATIEL PCF Methodology, 2024). Figure 3 shows how all these standards relate to one another at their respective levels.
Within a lubricant’s life cycle, we can identify different scopes, explained below and shown in Figure 4:
Cradle-to-Gate: covers raw material extraction, manufacturing, and packaging phases.
Cradle-to-Gate + Logistics: includes all previous phases plus the logistics of delivering the product to the end user.
Cradle-to-Grave: includes all previous phases plus the use phase of the lubricant.
Cradle-to-Cradle: includes all previous phases and the product returns to the beginning of the cycle as raw material again.
[Figure 4] Definition of scopes for product carbon footprint (PCF) evaluations. Source: API TR 1533, 2023
Under another approach for identifying where emissions come from throughout the product’s life cycle, the most widely used methodology worldwide is the Greenhouse Gas Protocol (GHG Protocol), which classifies emissions into three categories known as Scope 1, Scope 2, and Scope 3. While life cycle approaches establish how far the analysis reaches, the GHG Protocol allows identifying who generates the emissions and at which stage of the value chain they are produced. Both concepts are complementary, as shown in Figure 5. A Cradle-to-Gate study, for example, can include Scope 1 and Scope 2 emissions from the production plant, as well as Scope 3 emissions associated with raw materials and transport (known as Upstream). Similarly, a Cradle-to-Grave analysis additionally incorporates the emissions generated during the use of the product and its final disposal, which normally are also part of Scope 3 (known as Downstream).
To be more precise, below are further details of the three GHG Protocol scopes, also shown in Figure 6 (GHG Protocol, 2013):
Scope 1: Direct emissions from sources owned or controlled by the company, such as fuels used in production processes or the company’s own vehicles.
Scope 2: Indirect emissions associated with the generation of energy purchased and consumed by the company — mainly electricity, steam, heating, or cooling.
Scope 3: split into two flows:
Upstream: Indirect emissions generated before the product reaches the company, including raw materials, transport of inputs, contracted services, and operational waste management. Sub-categories: Purchased Goods and Services; Capital Goods; Fuel and Energy-Related Activities; Upstream Transportation and Distribution; Waste Generated in Operations; Business Travel; Employee Commuting; Upstream Leased Assets.
Downstream: Indirect emissions generated after the product leaves the company, including distribution, product use by the customer, and end-of-life treatment. Sub-categories: Downstream Transportation and Distribution; Processing of Sold Products; Use of Sold Products; End-of-Life Treatment of Sold Products; Downstream Leased Assets; Franchises; Investments.
[Figure 6] Overview of the GHG Protocol scopes and emissions along the value chain. Source: GHG Protocol, 2013
As can be seen, Scope 3 is made up of 15 different categories, split between Upstream and Downstream. From the lubricant manufacturer’s perspective, Scopes 1, 2, and 3 (upstream) are part of what we call the “Handprint” (environmental footprint), which is the total impact the product causes until it reaches the end user. Meanwhile, Scope 3 (downstream) is part of what we call the “Footprint” (positive handprint) — all the impact the product can help avoid once in the user’s hands. Therefore, if we evaluate from the end user’s perspective, their “Handprint” is the lubricant manufacturer’s “Footprint.”
The importance of the use phase
One of the most relevant findings of recent studies on lubricant life cycles is that the use phase represents the stage of greatest environmental impact. The performance of a lubricant during equipment operation largely determines its contribution to energy consumption, component service life, maintenance frequency, and — consequently — greenhouse gas emissions. Therefore, evaluating only the emissions associated with lubricant production (cradle-to-gate) provides an incomplete view of its real impact.
Van Rensselar (2025) points out that the use phase clearly dominates the product carbon footprint in lubricants, since friction reduction and extending component service life can offset and even exceed the emissions generated during the extraction, production, transport, and disposal stages. Consistently, the GfT study (Woydt et al., 2023) reaches the same conclusion, demonstrating that reducing friction during operation can generate environmental benefits greater than the emissions associated with the development and manufacturing of high-performance lubricants. Boyde et al. (2000) also mentions that optimizing three lubricant performance parameters — friction reduction, wear reduction, and lubricant stability — will lead to a positive environmental impact.
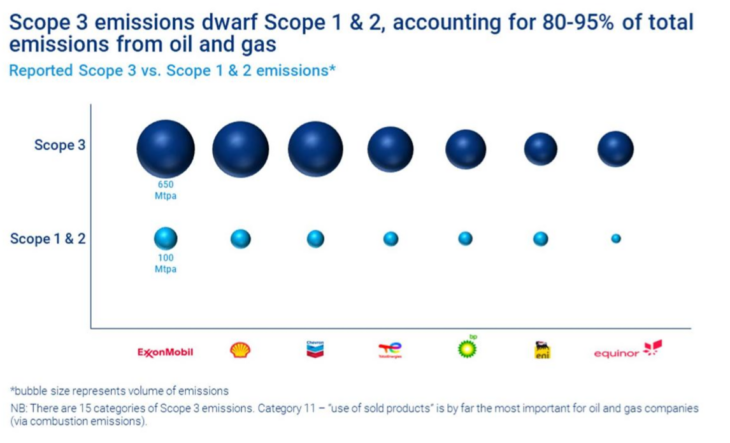
Aligned with this, a Wood Mackenzie publication (Wood Mackenzie, 2022) presented emissions from the largest Oil & Gas companies in the world, such as ExxonMobil, Shell, and Chevron, among others. It was identified that between 80% and 95% of these companies’ CO₂ emissions are related to Scope 3 of the GHG Protocol, as shown in Figure 7. Furthermore, category 11 (use of sold products) is by far the one with the greatest impact within Scope 3.
This leads us to conclude that, to evaluate the true impact of a lubricant or tribological solution, it is essential to consider its performance during the use phase. A bio-based lubricant may have a lower emission factor when analyzed at the cradle-to-gate scope compared to a mineral one. However, if that product does not offer performance at least equal to the mineral one when applied, it is highly likely that the lower-impact solution will actually be the petroleum-derived product.
The development of bio-based lubricants is therefore a very important area for the sustainability of industrial processes, but it goes far beyond simply using renewable, non-toxic products. It must consider the operating conditions of the application and offer adequate performance in order to, ultimately, generate a lower environmental impact.
Another point is that, within the use phase itself, there may be solutions that offer greater energy efficiency but higher wear levels, while others may offer the lowest wear but with more energy losses. How to evaluate which of the two solutions offers the lowest environmental impact and the best cost-benefit ratio? A structure that brings clarity to all these variables and helps measure the real impact of a lubricant or tribological solution during the use phase can be the answer to this question.
Impacts of a lubricant during its use phase
It is not by chance that investments in lubrication are said to be like picking the lowest-hanging fruit: they are the easiest to reach and generate immediate benefits. In general, the lubricant represents only about 2% of the maintenance budget. This means the impact of investing in a higher-cost-per-liter oil will be very small in the department’s annual expenses. On the other hand, the indirect impact this oil can have is estimated to reach as much as 40% of the maintenance budget (Figure 8). In other words, the (not so) simple act of having a good lubrication program can help reduce nearly half of the maintenance costs — without even mentioning operating costs.
[Figure 8] Impact of lubrication on the maintenance department budget.
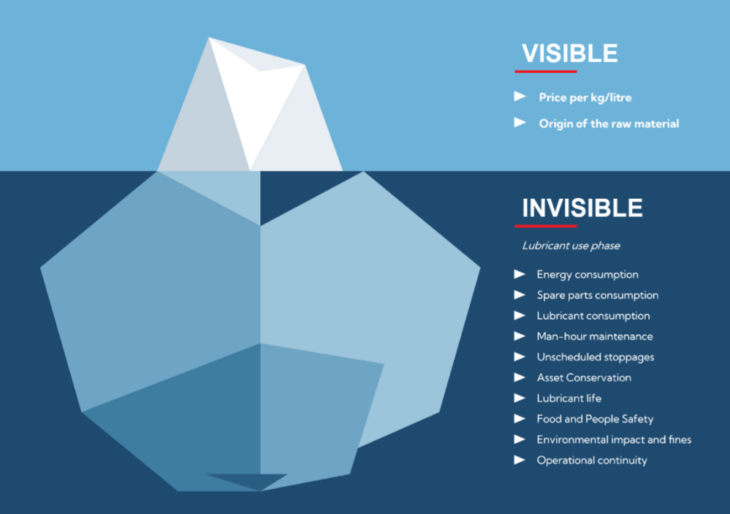
However, quite often the “lube champion” who wants to carry out a lubrication improvement project at the company runs into the barrier of lubricant price. Switching from a mineral to a synthetic, from a simple soap to a complex one, or from an oil without additives to another with special additives, means increasing the price per liter or per kg of the lubricant. And who wants price increases? Nobody. Moreover, the price is real and easy to see: it is clear and right in your face, the tip of the iceberg. The impact of good lubrication, however, is hidden — it is a promise and the bottom part of the iceberg (Figure 9). That is why the “lube champion” must be able to show these hidden impacts and follow a process to prove the benefits.
[Figure 9] The lubrication impact iceberg.
Drawing a parallel with the life-cycle cost of machinery, R. Keith Mobley, in his book Plant Engineer’s Handbook (2001), notes that acquisition and installation costs alone typically account for less than 20% of a compressor’s life-cycle cost. Many manufacturers confirm this, such as Atlas Copco and Kaeser. This means that approximately 80% of the costs of a machine over its useful life are not with purchase, but with energy, maintenance, operation, and disposal — that is, hidden costs. Energy will generally have the largest impact, although the percentages can vary depending on the type of machine. In any case, the lubricant is not only part of it (through its consumption) but also has an impact on many of these costs.
One way to view the impacts of lubrication is through the different departments of a company. Lubrication can impact on maintenance, reliability, production, quality, safety, and the environment. This division depends somewhat on how the company is structured — whether or not it has a reliability department, whether an integrated asset management system is used, whether the safety and environment areas are combined, among others.
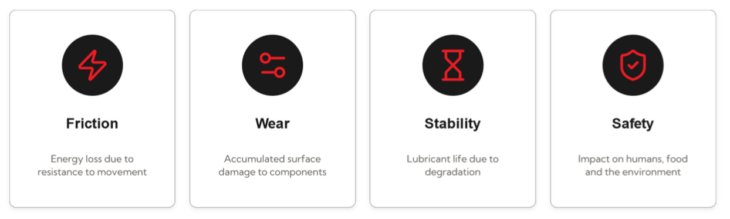
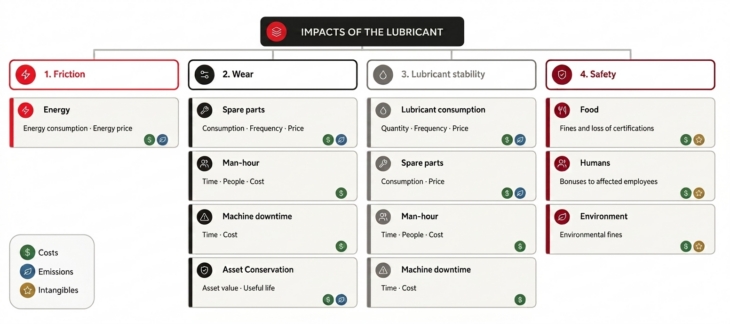
Therefore, thinking of a more definitive proposal, it can be analyzed from the lubricant’s perspective. Through tribology, we know that the lubricant affects friction and wear. Through chemistry, we understand that the lubricant degrades and has a finite life (stability). Finally, this chemical product — the lubricant — can affect the safety of its surroundings (humans, food, or the environment). And that is the proposed division of all the impacts of lubrication in industry (Figure 10):
Friction
Wear
Stability
Safety
[Figure 10] The four categories of lubrication impact.
The friction / wear division is already suggested in Holmberg’s articles (Holmberg et al., 2017) on the impacts of tribology on energy consumption, costs, and emissions. In Boyde et al. (2000), for the lubricant use phase, this same friction / wear division is also proposed, adding lubricant stability (useful life). Finally, the safety category was included because during use the lubricant can affect its surroundings — more specifically, humans, food, or the environment.
Each of these categories can have an impact not only on costs, but also on greenhouse gas emissions and intangible impacts (for example, environmental contamination which, despite being subject to fines, cannot be estimated in full through costs and emissions alone). In addition, emissions can in turn have an impact on costs again, since in some countries a carbon market already exists in which emission savings can be translated into monetary value.
Impacts: friction
Friction is the resistance to relative motion between two surfaces in contact. For movement to occur, this resistance must be overcome — in other words, enough energy must be put in to overcome friction and move the parts. In this way, friction can be understood as a loss of energy, which is the hidden impact of friction.
Suppose we need to move a large piece of furniture from one place in our house to another. We push the furniture with all our strength, but it does not move. We place a piece of cardboard under each of the furniture’s legs, and now, when we push, it moves. We reduced friction and, with less energy, it was possible to perform a specific task. In this case, the cardboard was our lubricant, but we can easily bring this idea to an industrial context.
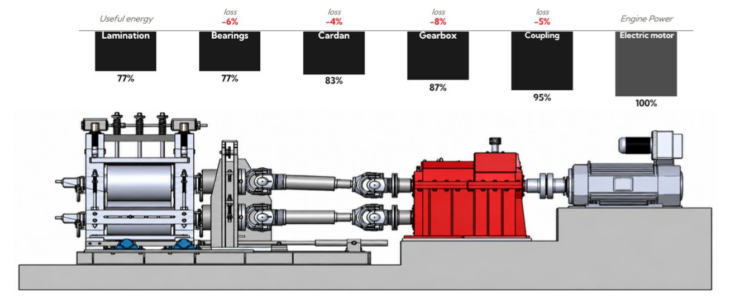
Any machine needs energy to perform a task. For example, a rolling mill needs energy to reduce the thickness of a slab (Figure 11). The electric motor draws this energy from the grid, but between the arrival of electrical energy at the motor and the mechanical energy of rolling there are many components in friction — that is, points of energy loss. The motor itself has mechanical and electrical losses, and additionally the couplings, gearboxes, and bearings are also loss points. In the end, the motor must draw enough energy to overcome all these summed losses plus the rolling energy itself. Therefore, reducing friction in mechanical components means reducing energy losses, which in turn means reducing energy consumption.
[Figure 11] Example of energy losses in a rolling mill.
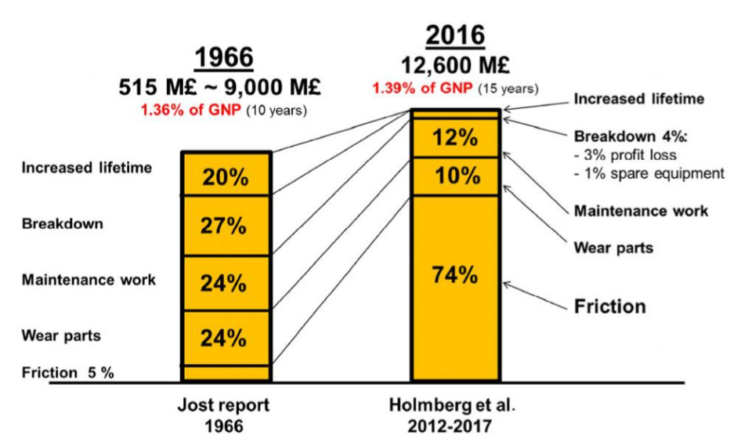
The first studies on the economic impact of tribology, carried out by Peter Jost in the 1960s and 1970s, showed that by adopting more advanced tribological technologies, significant savings could be achieved — estimated at 515 million pounds sterling annually in England, equivalent to 1.36% of GDP at the time. Although only 5% of these savings corresponded to reducing energy consumption through friction reduction, the rest was related to wear, failures, and maintenance. In a 2016 update of the study, it was concluded that it is still possible to achieve a reduction of 1.39% of GDP, but now 74% of the savings is attributed directly to improved energy efficiency thanks to reduced friction (Figure 12). This highlights that tribology represents a key tool for improving energy efficiency (Jost, 1966, 1974; Holmberg & Erdemir, 2017).
[Figure 12] Impact of friction and wear on a country’s GDP. Source: Holmberg & Erdemir, 2017
Holmberg & Erdemir (2017) also calculated the potential reduction in energy consumption through the implementation of new tribological technologies, including lubricants, that already exist and that can still be developed. From a short-term perspective (8 years), the reduction potential is 18%, and it can reach 40% over the long term (15 years). Figure 13 presents this 8-year potential in terms of energy consumption, financial impact, and emissions by industrial sector.
[Figure 13] 8-year savings potential through tribology, by sector. Source: Holmberg & Erdemir, 2017
In recent years, constant increases in energy costs have placed significant pressure on the profitability of companies across various industrial sectors. This scenario has led many organizations to actively seek strategies to reduce their energy consumption without compromising productivity. In this context, energy efficiency has become a priority, driving the adoption of technologies, processes, and practices that reduce friction losses in machines through lubrication.
In addition to costs, producing 1 kWh of electrical energy requires a process that emits some amount of greenhouse gases into the atmosphere. Depending on the process, this factor can vary from 4 g or less (renewable energy sources) to 1 kg (fossil fuel combustion) of CO₂-eq emitted per kWh produced. This means that emissions will depend on the energy mix of each country and consumption region. However, regardless of that, the fact of reducing energy consumption means reducing greenhouse gas emissions (IPCC, 2011; EPA, 2025; IEA, 2025).
There are many ways to achieve this reduction in friction and energy consumption through lubrication. Switching from a mineral to a synthetic lubricant has been studied and proven to yield up to 30% savings in gearboxes and compressors (Liu et al., 2020). In bearings, avoiding grease over-application can also contribute to reducing energy losses. In a publication in Machinery Lubrication, Wes Cash presents six ways to conserve energy through lubrication:
Adequate viscosity
Adequate quantity
Adequate base oil type
Adequate additives
Adequate application method
Adequate lubrication frequency
In summary, the hidden impact of friction is:
Energy consumption
Impacts: wear
Wear is the surface damage of one or all of the solid surfaces in contact subjected to relative motion. This accumulated damage affects the mechanical components of machines and their operation, generating negative consequences on maintenance and operating costs. As already shown in Figure 12, although in general it is smaller than friction, wear also represents an important part of tribology-related losses. In fact, depending on the industry, the potential of wear can exceed that of friction, as in the mining industry (Holmberg et al., 2017a).
Wear affects the mechanical component in operation, reducing its useful life and requiring its replacement. However, the cost impact goes far beyond the simple cost of purchasing a new component. When replacing a bearing, for example, the machine must be stopped (loss of productivity) and maintenance personnel must be mobilized to perform the task (man-hours). In addition, the replacement of spare parts impacts asset depreciation. Additionally, producing a spare part also translates into emissions throughout its life cycle. For producing a 22218 bearing, SKF mentions on its page that 12.5 kg of CO₂-eq are emitted, which corresponds to approximately 3.7 kg of CO₂-eq per kg of bearing. At the end of the day, therefore, reducing spare-parts consumption also translates into reducing greenhouse gas emissions into the atmosphere (SKF, 2026).
Therefore, the hidden impacts of wear are:
Spare-parts consumption
Maintenance man-hours
Machine downtime
Asset conservation
In terms of costs, in the vast majority of cases, machine downtime represents the largest share. Unlike spare-parts consumption, maintenance man-hours, or asset conservation, machine downtime implies a complete production stop, which generates immediate losses in productivity, delivery failures, and disruptions in the supply chain. Every minute of inactivity can translate into considerable monetary losses — far higher than the direct costs of maintenance or spare parts.
Reducing wear — and therefore all of its hidden impacts — can also be achieved through good lubrication practices and appropriate lubricant selection. At the end of this article, we will present success cases with the impact of these costs.
Impacts: stability
Stability refers to the lubricant’s ability to withstand application conditions without degrading. In other words, it is the useful life of the lubricant. A very low lubricant life also affects maintenance and production costs, in addition to the lubricant consumption itself.
Lubricants are chemical products that degrade in contact with oxygen, contaminants, temperature, load, and other process conditions. Base oil type and additives play a crucial role in the lubricant’s ability to withstand these conditions and offer a longer service life in a given application. Good lubrication practices can also contribute to and increase the lubricant’s life.
A degraded lubricant requires replacement, affecting lubricant consumption. In addition, expenses are needed for maintenance-team man-hours to perform the task and, in some cases, the machine must be stopped so the task can be carried out. Finally, when changing the lubricant, other spare parts often need to be replaced as well — for example, in a compressor, filters are replaced whenever the oil volume is changed. Similarly, increasing lubricant consumption due to degradation means increasing the CO₂-eq emissions related to its production. Depending on the base and additives, emissions will vary, but a basic mineral oil, for example, can exceed 2 kg of CO₂-eq emitted per kg of oil produced (Ferdous et al., 2026).
In summary, the hidden impacts of stability are:
Lubricant consumption
Spare-parts consumption
Maintenance man-hours
Machine downtime
The cost of lubricant consumption is where the price of the lubricant does come into play. However, this must be considered together with the consumption volume. That is, price is one point among the many presented that must be considered when performing an economic viability assessment of a new lubricant.
Impacts: safety
Finally, safety also has great importance in the costs impacted by lubrication. This is because the lubricant, as a chemical product, can affect its surroundings in various ways. The health of the humans in contact with the lubricant, the environment that can be contaminated, or even food that may be affected — generating problems for consumers.
As an example, we know that the consumption of mineral lubricants has a huge environmental impact. Approximately 50% of the 30 to 40 million tonnes of lubricants produced annually end up in the environment in some way, and petroleum-derived lubricants are responsible for around 95% of this contamination. In fact, a single liter of used mineral oil can contaminate more than 20,000 liters of water (Kurre & Yadav, 2023; Hamdan et al., 2018). These lubricants also contribute to atmospheric pollution and pose serious risks to soil fertility and ecosystem health; they can persist in the environment, accumulate in soil and water, and potentially reach the food chain (Díaz et al., 2017; McNutt & He, 2016).
The costs of the safety category will generally be related to fines, loss of certification, bonus payments to employees, or product “recalls” (of food products, for example). However, although important, it is not at all easy to have the exact data or at least to estimate these costs. Arriving at the value of a fine or a “recall,” for example, is not simple and depends on many factors, which is why this category is often not considered. That is why, obviously, in addition to costs, there is a very large intangible component that cannot be measured in monetary terms.
According to NSF (2021), one of the world’s largest food-grade lubricant certifiers, a large share of product recalls in the food and beverage sector between 2008 and 2017 — 55% — were due to chemical contaminants and biotoxins, and a single recall can cost producers as much as $10 million in direct costs, underscoring the financial stakes of this topic for companies.
In summary, the hidden impacts of safety are related to the impact of lubricants on:
Humans
Food
Environment
Integrated view of the impacts
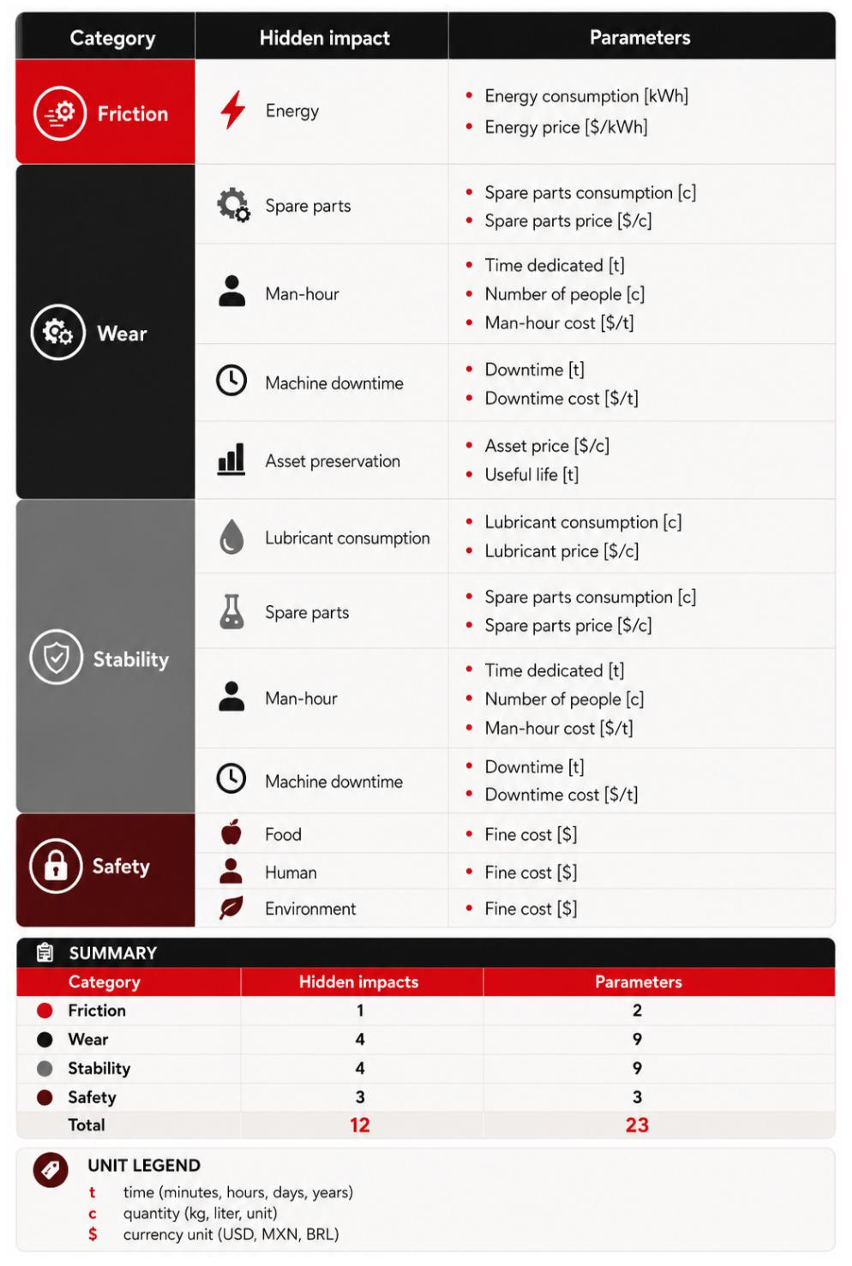
As presented, the hidden impacts of lubrication are divided into 4 categories: friction, wear, stability, and safety. Each category has its own subdivisions, as mentioned in each previous section, totaling at least 12 different impacts that can be related to lubrication in a company. Each impact has different parameters to consider, and they can be related to costs, emissions, or intangibles — as shown in Figure 14.
[Figure 14] Complete structure of impacts in each category.
The parameters evaluated in each of the impacts can add up to more than 20, in addition to the price of the lubricant. In other words, considering only the price of a lubricant in a decision-making process means taking into account less than 5% of the total parameters that impact on the company’s costs, as can be observed in Figure 15.
[Figure 15] Table with all parameters for a complete evaluation.
Of course, not always all of them will be used in a cost-benefit or environmental impact evaluation, since some may be difficult to obtain (such as those of safety) or may not be technically feasible at the time of the project (such as energy, which requires specific sensors and a more in-depth study). In any case, it is always important to keep them in mind when evaluating a new lubricant for a given application.
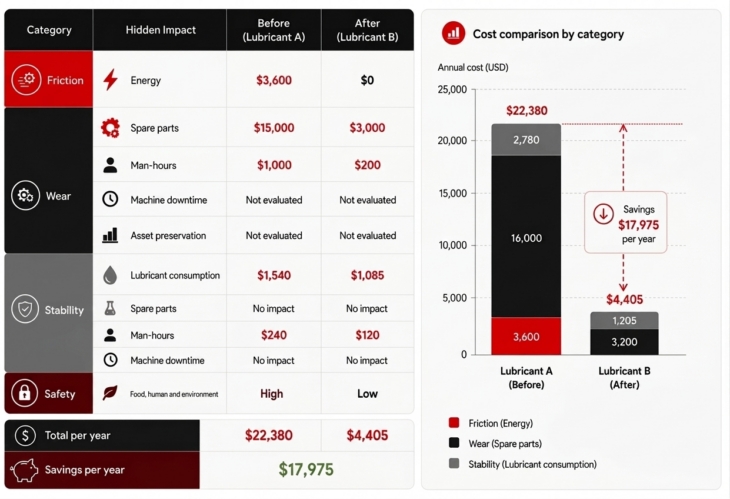
In this way, the comparison between different lubricant solutions should be presented as shown in Figure 16, where there may be differences between the categories, but the final savings depend on the sum of all of them — whether in costs or in emissions.
[Figure 16] Example of comparison of costs or emissions between two lubricants.
In the structure presented, the main impacts for any type of industry were considered. However, when comparing two lubricant solutions, other impacts may arise that were not considered here and that may be relevant for the final decision — product-rejection losses, logistics costs, or required storage space are some examples of impacts that could be considered in the analysis.
Another point is investments: when switching lubricant solutions, investments in application equipment, production stops for the trial, and expenses on spare parts, among others may be necessary.
Case study
Finally, a case study is presented that helps break the paradigm of the higher-priced lubricant and apply the structure presented in this article. The case shown is a situation in which the lubricant price was higher; however, the hidden impacts helped prove that it was the best solution for the application.
Case 01: Glass factory saves $16k with new grease and good lubrication practices
Application data:
Industry: Glass factory
Process: Combustion air cleaning
Critical equipment: Electrostatic precipitator fan
High speed
Speeds of 1750 rpm
Temperature at 77 °C
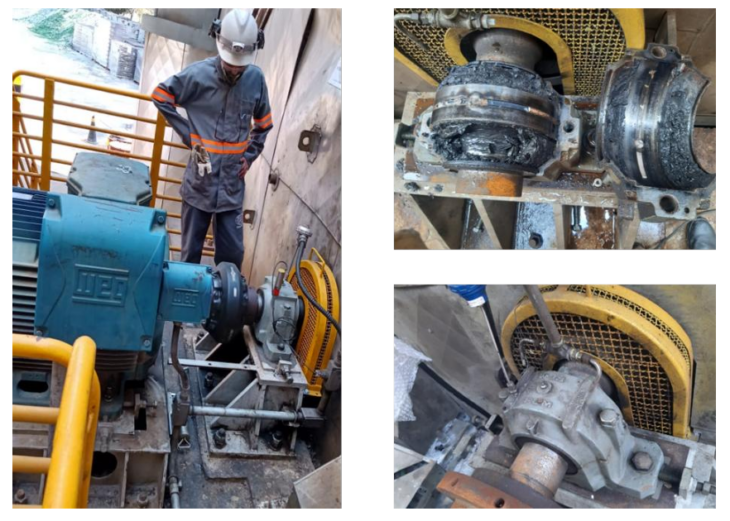
Detected problems (Figure 17):
The lubricant used (lithium-complex grease, Lubricant A) was being applied in excess, which caused high temperatures
High wear and bearing failure
Compressed-air consumption to cool the bearing housing
[Figure 17] Detail of the bearing housings, burnt grease, and compressed air.
Solution:
Proposed product (Lubricant B): Lithium-complex grease with biodegradable synthetic oil at the ideal viscosity for the bearing and in the exactly calculated quantity and frequency.
Price and consumption comparison:
Price of Lubricant A: $22 / kg — Consumption: 70 kg per year
Price of Lubricant B: $31 / kg — Consumption: 35 kg per year
Cost-benefit evaluation:
[Figure 18] Evaluation of the annual financial impact before and after Case 01.
Emissions impact evaluation:
[Figure 19] Evaluation of the emissions impact before and after Case 01.
In this case, the higher price of the grease (>40%) was offset by the hidden costs that were reduced. Beyond the grease and spare-parts consumption, compressed air was eliminated — and, with it, its energy costs. Another point is that, since this is an electrostatic precipitator, it is critical equipment: if it is not in operation, contaminated air is released into the atmosphere. And any bearing change requires shutting down the equipment, allowing contaminated air to pass through. Therefore, safety (environment) is not evaluated quantitatively due to the difficulty, but qualitatively.
References
Ali, M., Evans, S.W., 2025. The impact of best practice on energy efficiency in industrial decarbonization policy. Energy Policy 204, 114632. https://doi.org/10.1016/j.enpol.2025.114632
American Petroleum Institute (API), 2023. API Technical Report 1533: Lubricants Life Cycle Assessment and Carbon Footprinting — Methodology and Best Practice. American Petroleum Institute, Washington, DC.
ATIEL, UEIL Joint Sustainability Committee, 2024. Methodology for Product Carbon Footprint Calculations for Lubricants, Greases, and Other Specialties, Version 1.1. ATIEL & UEIL, Brussels.
Boyde, S., Randles, S., Gibb, P., Corr, S., Dowdle, P., 2000. Effect of Lubricant Properties on Efficiency of Refrigeration Compressors. Proceedings of the International Compressor Engineering Conference, Purdue University, pp. 311–318.
Díaz, L., Fernández-Ruiz, J., García, M.T., et al., 2017. A pervaporation-assisted bioreactor to enhance efficiency in the synthesis of a novel biolubricant based on the enzymatic transesterification of a castor oil-based biodiesel. Fuel 208, 58–68. https://doi.org/10.1016/j.fuel.2017.05.025
Ferdous, S., Gracida-Alvarez, U.R., Benavides, P.T., Urgun-Demirtas, M., 2026. An integrated techno-economic analysis and life cycle assessment of lube oil production from post-use polypropylene and comparison with conventional base oils. RSC Sustainability 4(5), 2321–2336. https://doi.org/10.1039/D5SU00910C
Hamdan, S.H., Chong, W.W.F., Ng, J.-H., Chong, C.T., Zhang, H., 2018. Nano-tribological characterisation of palm oil-based trimethylolpropane ester for application as boundary lubricant. Tribology International 127, 1–9. https://doi.org/10.1016/j.triboint.2018.05.040
Holmberg, K., Erdemir, A., 2017. Influence of tribology on global energy consumption, costs and emissions. Friction 5(3), 263–284. https://doi.org/10.1007/s40544-017-0183-5
Holmberg, K., Kivikytö-Reponen, P., Härkisaari, P., Valtonen, K., Erdemir, A., 2017. Global energy consumption due to friction and wear in the mining industry. Tribology International 115, 116–139. https://doi.org/10.1016/j.triboint.2017.05.010
Intergovernmental Panel on Climate Change (IPCC), 2011. Special Report on Renewable Energy Sources and Climate Change Mitigation (SRREN). Cambridge University Press, Cambridge.
Kurre, S.K., Yadav, J., 2023. A review on bio-based feedstock, synthesis, and chemical modification to enhance tribological properties of biolubricants. Industrial Crops and Products 193, 116122. https://doi.org/10.1016/j.indcrop.2022.116122
McNutt, J., He, Q., 2016. Development of biolubricants from vegetable oils via chemical modification. Journal of Industrial and Engineering Chemistry 36, 1–12. https://doi.org/10.1016/j.jiec.2016.02.008
U.S. Environmental Protection Agency (EPA), 2025. GHG Emission Factors Hub. January 2025 Edition. Center for Corporate Climate Leadership, Washington, DC.
Van Rensselar, J., 2025. Quantifying Sustainability. Tribology & Lubrication Technology (TLT), Society of Tribologists and Lubrication Engineers (STLE), April 2025.
World Resources Institute (WRI), World Business Council for Sustainable Development (WBCSD), 2013. Technical Guidance for Calculating Scope 3 Emissions (Scope 3 Calculation Guidance). Greenhouse Gas Protocol, Washington, DC.
Woydt, M., Hosenfeldt, T., Luther, R., Scholz, C., Wincierz, A.C., Schulz, J., 2021. Wear Protection and Sustainability as Cross-Sectional Challenges.
Woydt, M., Bock, E., Hosenfeldt, T., Bakolas, V., Luther, R., 2023. Effects of Tribology on CO₂ Emissions in the Use Phase of Products. Gesellschaft für Tribologie (GfT).
Raul FernandesLubrication and Reliability Engineer, Interlub Group
Mechanical engineer with a master’s degree in tribology and more than 15 years of expertise in asset reliability and industrial maintenance. Certified by the International Council for Machinery Lubrication (ICML) as an MLT II, FPL and MLE, Raul combines deep technical knowledge with practical field experience. He has authored a peer-reviewed paper published by Elsevier, contributing to the advancement of tribological studies. Also, he has presented at the STLE webinar “Industry Insights” about rolling bearing lubrication and at the Luubricant Expo Europe 2025 about biolubricants. Throughout his career in Interlub Group, Raul has focused on using specialized lubrication to achieve consistent results in reducing environmental impact across many industrial sectors such as steel, mining and food. He is passionate about sharing knowledge in lubrication and tribology and today publishes articles for the Interlub blog, ICML’s The Lube Room magazine, Noria’s Machinery Lubrication and Lube Magazine (Lube-Tech).
By using this site you agree to our use of cookies. You are free to manage this via your browser setting at any time. To learn more about how we use the cookies please see our cookies policy.






 [Figure 8] Impact of lubrication on the maintenance department budget.