INTRODUCTION
Electrical Signature Analysis (ESA) was initially developed at Oak Ridge National Labs (ORNL) in the 1980s as a method for evaluating bearings and gears in motor operated valves in the nuclear power industry.i In 1992, the technology was licensed into general industry for applications in utilities and commercial applications. Starting in the late 1980s, the technology was investigated by the Electric Power Research Institute, universities, and others under the term Motor Current Signature Analysis (MCSA). Much of the work focused on rotor condition testing with very little focus on areas outside of electric motors and, in few instances, generators.ii
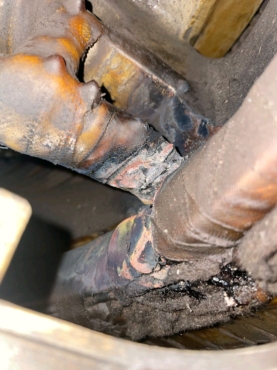
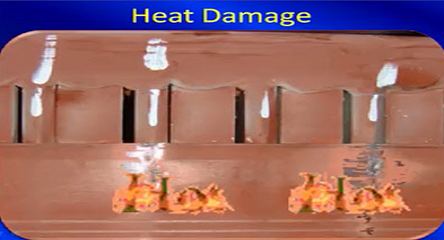
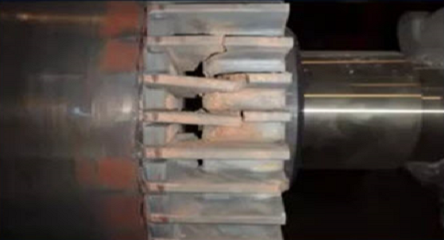
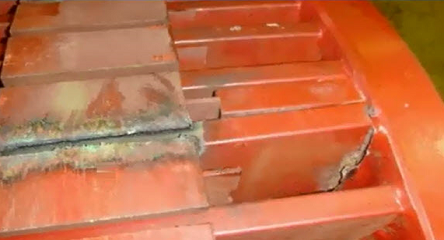
Figure 1: Failed Wye Ring on DFIG Generator
In early 2003, the first reported testing of utility-scale wind turbines with ESA was performed followed by several attempts by companies, including at least one OEM, to use MCSA with current readings only. It is noted that as far back as 1988 ORNL identified that generators are analyzed using voltage signature analysis. It has been generally understood that voltage analysis is towards the supply (upstream) and current analysis is load (downstream). The discovery in 2004 was that DFIG
generators, depending on the windspeed and control design, can operate in such a way that signatures will move between voltage and current analysis. This suited ESA especially and periodic field tests were performed between 2004 and 2009. By 2010, a large wind owner funded work by MotorDoc LLC to evaluate stator wedge faults in several generator designs which was highly successful, which also led to the initial evaluation of the powertrain through testing performed from the base of a tower. In 2016, the same wind owner again funded a project for evaluating the condition of DFIG rotor wye rings in GE 1.5 MW towers. In 2018, the results of the study, which resulted in a 100% detection of wye rings, and potential detection of a partial fracture of one other tower, were published at the AWEA O&M Conference in San Diego, CA. The further development of the technology for accuracy, resolution and cost continues including the application of continuous monitoring systems and other strategies.iii
FORM AND FUNCTION
The successful applications, to date, of ESA in windpower has been through expert systems in which software and analysts review voltage and current signatures and spectra. The addition of airgap analysis in torque and kilowatt spectral analysis adds to the accuracy of the technology. The spectral analysis resembles vibration analysis in most ways with peaks occurring in pairs as the carrier frequency is amplitude modulated and several proprietary methodologies due to the transducer. The airgap of the machine, itself, is the transducer with small variations in the airgap magnetic field having a significant impact on voltage or current as the rotor moves radially in relation to the stator. Torsional issues, such as driving through a failing bearing or worn/damaged gear, are identified as the magnetic field strength changes for that specific frequency. This allows for the analysis of the loss, in watts (or kilowatts) across the defect, which assists in determining severity of a condition from a single test.iv
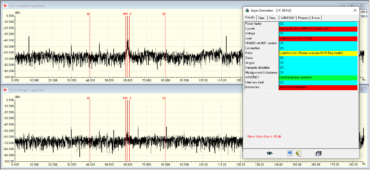
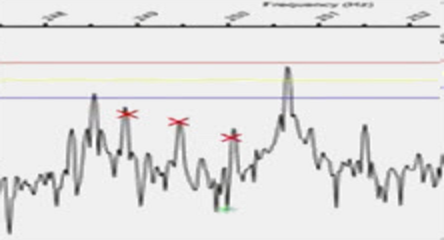
Figure 2: Spectral Analysis (low freq) of Windpower
As the field strength varies with load and analysis is generally performed, for voltage and current, in decibels down from the peak values at line frequency and watts are relational to total watts of the machine, the test is not considered load dependent. In the case of windpower, the tower is only required to be connected and generating, although electrical stresses and noise due to the inverter interaction with the rotor and airgap occur. However, these happen at very specific frequencies that generally do not interfere with analysis when the spectral resolution is within 0.01 Hz or better. The resolution also impacts the ability to detect different defects in the system as general resolution of greater than 0.01 Hz (0.6 CPM) tend to blend bearing, mechanical components, and rotor signatures together. An FMAX of at least 5 kHz is also critical in detecting gearbox, rotor, stator, transformer, and inverter defects, something that is generally not found in most technologies including vibration analysis for purposes of memory. This also added to the challenge that extreme resolution and high FMAX to view both very low and very high frequencies associated with transformer, inverter, generator and powertrain are required. Presently, there is one commercial technology that has been successful at meeting these requirements for both data collection and continuous monitoring, which is traced directly back to the original ORNL development.
COMPARATIVE ANALYSIS
There have obviously been a few bumps as the technology has continued to evolve as no technology or testing method is 100% all of the time. Comparisons to detection versus findings places the system and MotorDoc methodology at greater than 90% accuracy. More recently, a large windpower OEM and a South American wind owner performed a comparative analysis to determine accuracy using OEM technicians on DFIG towers in 2022 and 2023. Testing was performed between December 2022 and January 2023, findings inspected and/or repaired, and post testing performed in November, 2023, to determine accuracy and post conditions on 50 turbines. A second site is in the evaluation process at the time of this article with the condition, in both cases, that only the software capability would be employed (software rules and analysis vs technician). In the initial test, only 49 towers were available as one was out of commission for an extended period. The focus of the study was wye rings, although proactive analysis was performed on the other powertrain issues detected at the same success rate as wye ring fault detection.
The scoring system for wye ring defect detection is set up in a similar was as grades with: B meaning no finding; C meaning that the defect may be either a condition in the brush circuit (most likely) or wye ring (least likely); D meaning that the defect is most likely a progressing wye ring fracture or break or brush circuit issue; and F meaning that the system should be addressed immediately as a rotor failure is imminent. Of the proactive repairs:
1. B – two were found and neither had defects. This would be 100% accuracy.
2. C – thirteen were cited, one resulted in a wye ring replacement (pre-emptive) and seven had slip rings replaced, the others were cleaning and replacement of brushes, with only one requiring no corrective action. This would be 92.3% accuracy.
3. D – twelve were cited with one requiring slip ring replacement and no wye ring repair, one having no problems found (false positive), and ten resulting in replacing the wye rings. This
resulted in an 83.3% wye ring detection and 91.7% overall detection with one false positive and no false negatives.
The remaining are being evaluated with the above representing the ones cited with specific conditions. Overall, calls related to the wye rings and brush circuit overall on the first 27 machines is 92.6% accuracy with only two false positives and no false negatives. The second site identified one possible false negative, which are being evaluated.
CONCLUSION
Overall, properly applied ESA on windpower DFIG analysis of critical failures such as wye ring and brush circuit conditions, using only commercially available software analysis were greater than 90%, as expected. The balance of the comparative findings, to date, have been primarily false positives with few false negatives. With costs associated with this type of failure being significant, the accuracy of ESA, which exceeds the ~60% accuracy of visual inspections as reported at AWEA O&M 2018, provides a method of reducing technician wear and tear and extended offline inspections with greatly reduced risk. Similar results were found in multiple sites throughout the USA, Canada, Asia and Europe from a single test without the need to de-energize most towers (data collected down-tower and continuous monitoring).
Additional work on shaft currents related to main bearings, yaw motors, and similar auxiliary systems is being implemented with the results showing great promise in assisting OEMs in improvements. Similar work resulting from ESA application is being applied to root-cause of wye ring and other component fatigue wear, in addition to work related to utilizing specific exported data from the tower itself for processing in the software portion of the system. For the most part, the exported data can identify towers that need closer inspection.
i Howard D Haynes and David M Eissenberg, “Motor Current Signature Analysis Method for Diagnosing Motor Operated Devices,” Patent 4965513, Martin Marietta Energy Systems, Inc., Oak Ridge National Laboratories, November 14, 1989. ii Howard W Penrose, “Electrical and Motor-Current Signature Analysis,” ASM Handbook, Volume 18 Friction, Lubrication and Wear Technology Materials, Park, Ohio, 2017, pp. 18-21. iii Howard W Penrose, “Practical Electrical and Current Signature Analysis of Electrical Machinery and Systems,” SBD Publishing, Lombard, IL, 2022. iv Howard W Penrose, “Evaluating Wind-Turbine Generators through Electrical Signature Analysis,” Windpower Engineering & Development, October, 2015, Cleveland, OH, pp. 18-21.