INTRODUCTION
Reliability and maintenance remains one of the most significant impacts on commercial and industrial energy and emissions. Proper practices such as precision maintenance, lubrication, and condition-based maintenance programs can reduce the energy consumption in a standard-practice facility at least 14% and in a reactive-practice facility by 50%, or more. The primary challenge is always relating the energy followed by emissions improvements which can be accomplished with a variety of measurements. For the purposes of this article we will focus on Electrical Signature Analysis (ESA) and electrical measurements.
There are several ways to view the impact of maintenance practices using ESA and electrical measurements, the first is the use of simple overall kilowatt readings from a power analyzer or relay monitoring system; the second is the before and after readings from an ESA device that identifies kilowatt data by defect. In most cases defects should be measurable enough that a defective bearing or misalignment, for example, will show a difference in before and after readings. The challenge is identifying whether or not the load is the same. In the second case, when evaluating kilowatts in spectral analysis the peaks will show the total before and after. This means that the technician can identify the direct impact of lubrication or bearing replacement allowing the direct tie from the maintenance action to energy and emissions.
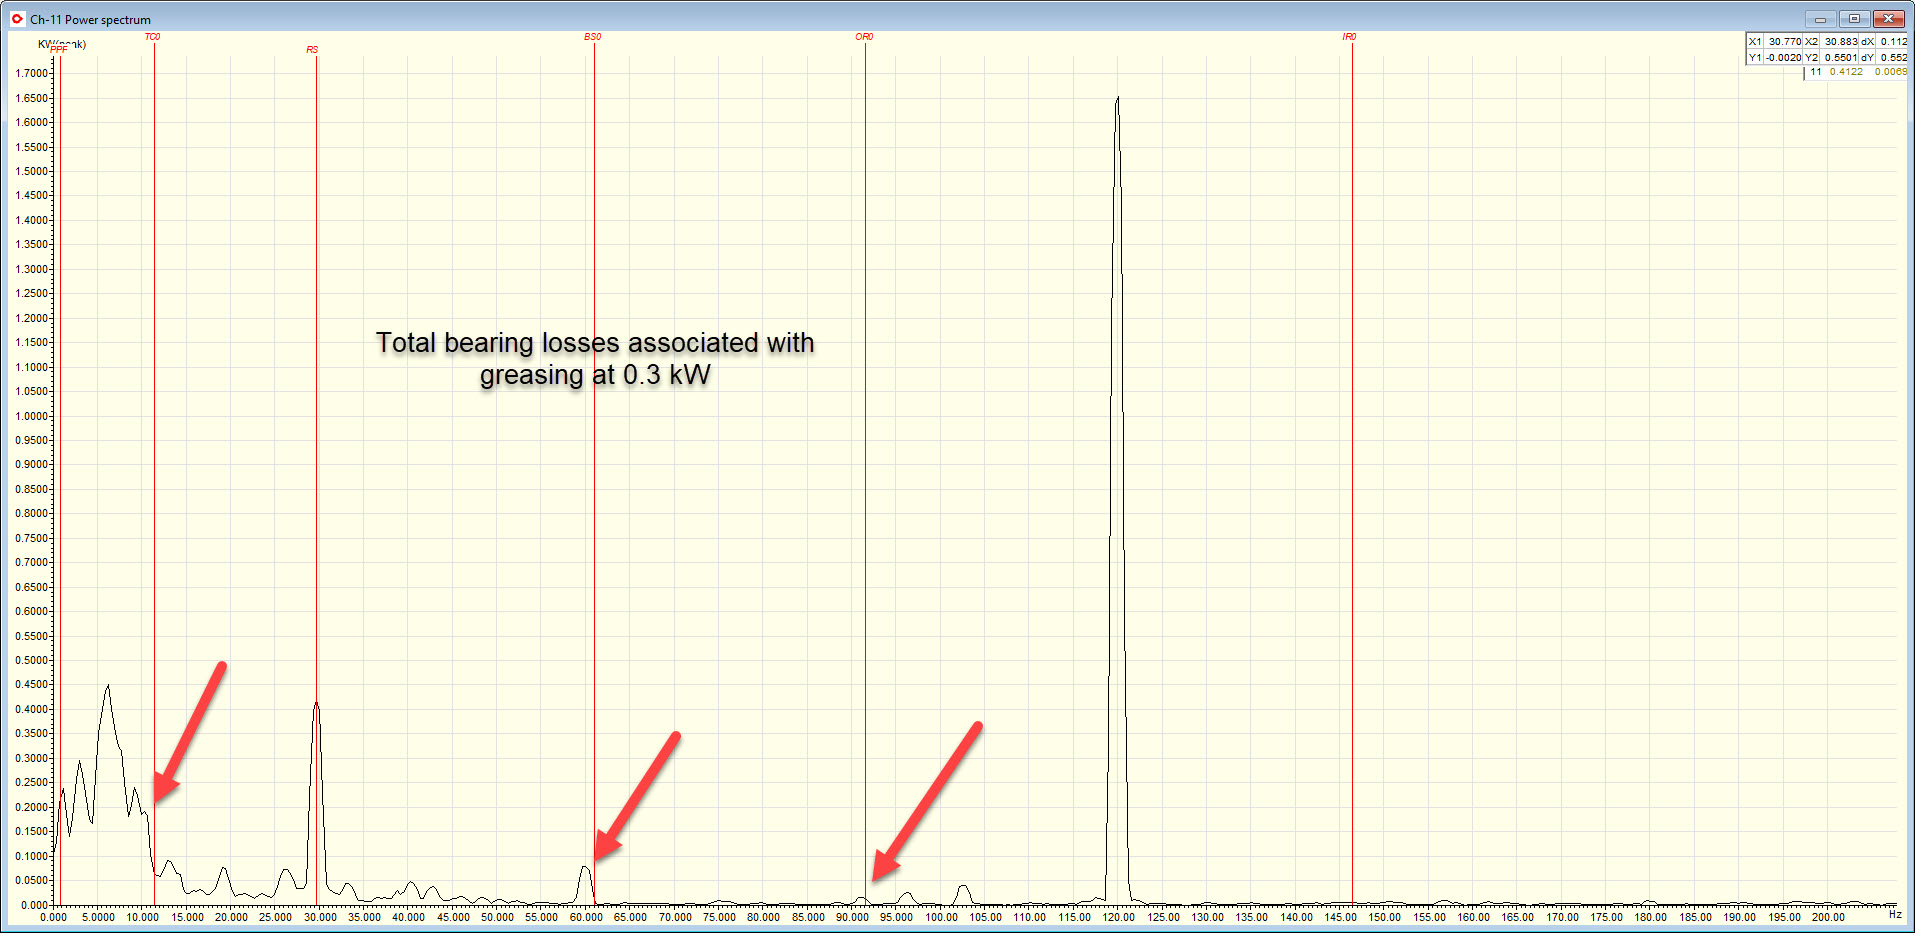
Figure 1: Losses attributed to lubrication on new motor and initial damage. Data using an EMPATH ESA System.
Figure 1 shows the power spectra of a new motor that did not have proper lubrication. The primary issue shows highest in the cage frequency (first red arrow) and the total including wear on the other bearing components is 0.3 kW. If the motor is operating 6000 hours per year, then this would amount to 1,800 kWh per year and at 0.707 metric tonnes CO2/MWh, 1.3 tonnes CO2 per year. As this defect would grow over the operating period, these values would become gradually higher until the bearing failed. Adding lubrication would be expected to slow the existing damage.
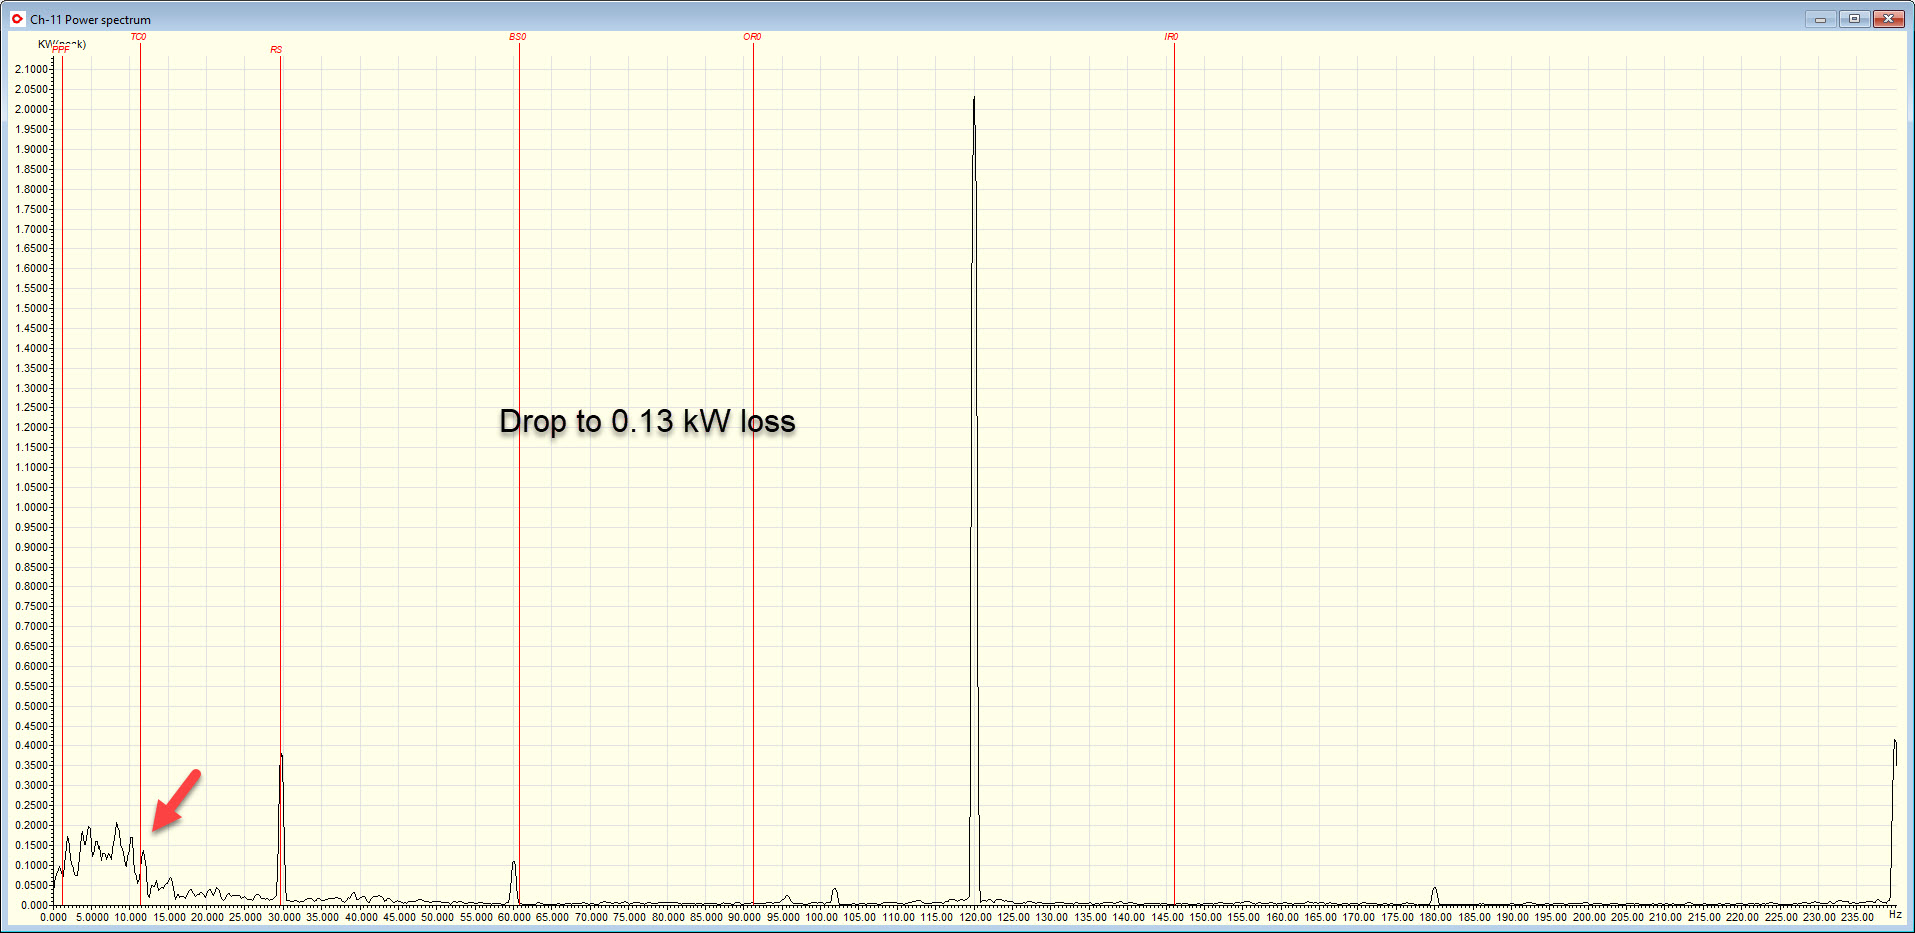
Figure 2: Immediately following lubrication the bearing losses drop to 0.13 kW with the remainder being friction and damage losses.
As shown in Figure 2, lubrication does not drop the losses to zero and represents an improvement of 0.17 kW, which is a savings of 1,020 kWh per year and 0.7 tonnes of CO2. Should a proper lubrication program be in place, the savings would be higher. The larger peak in both Figures represent harmonic losses.
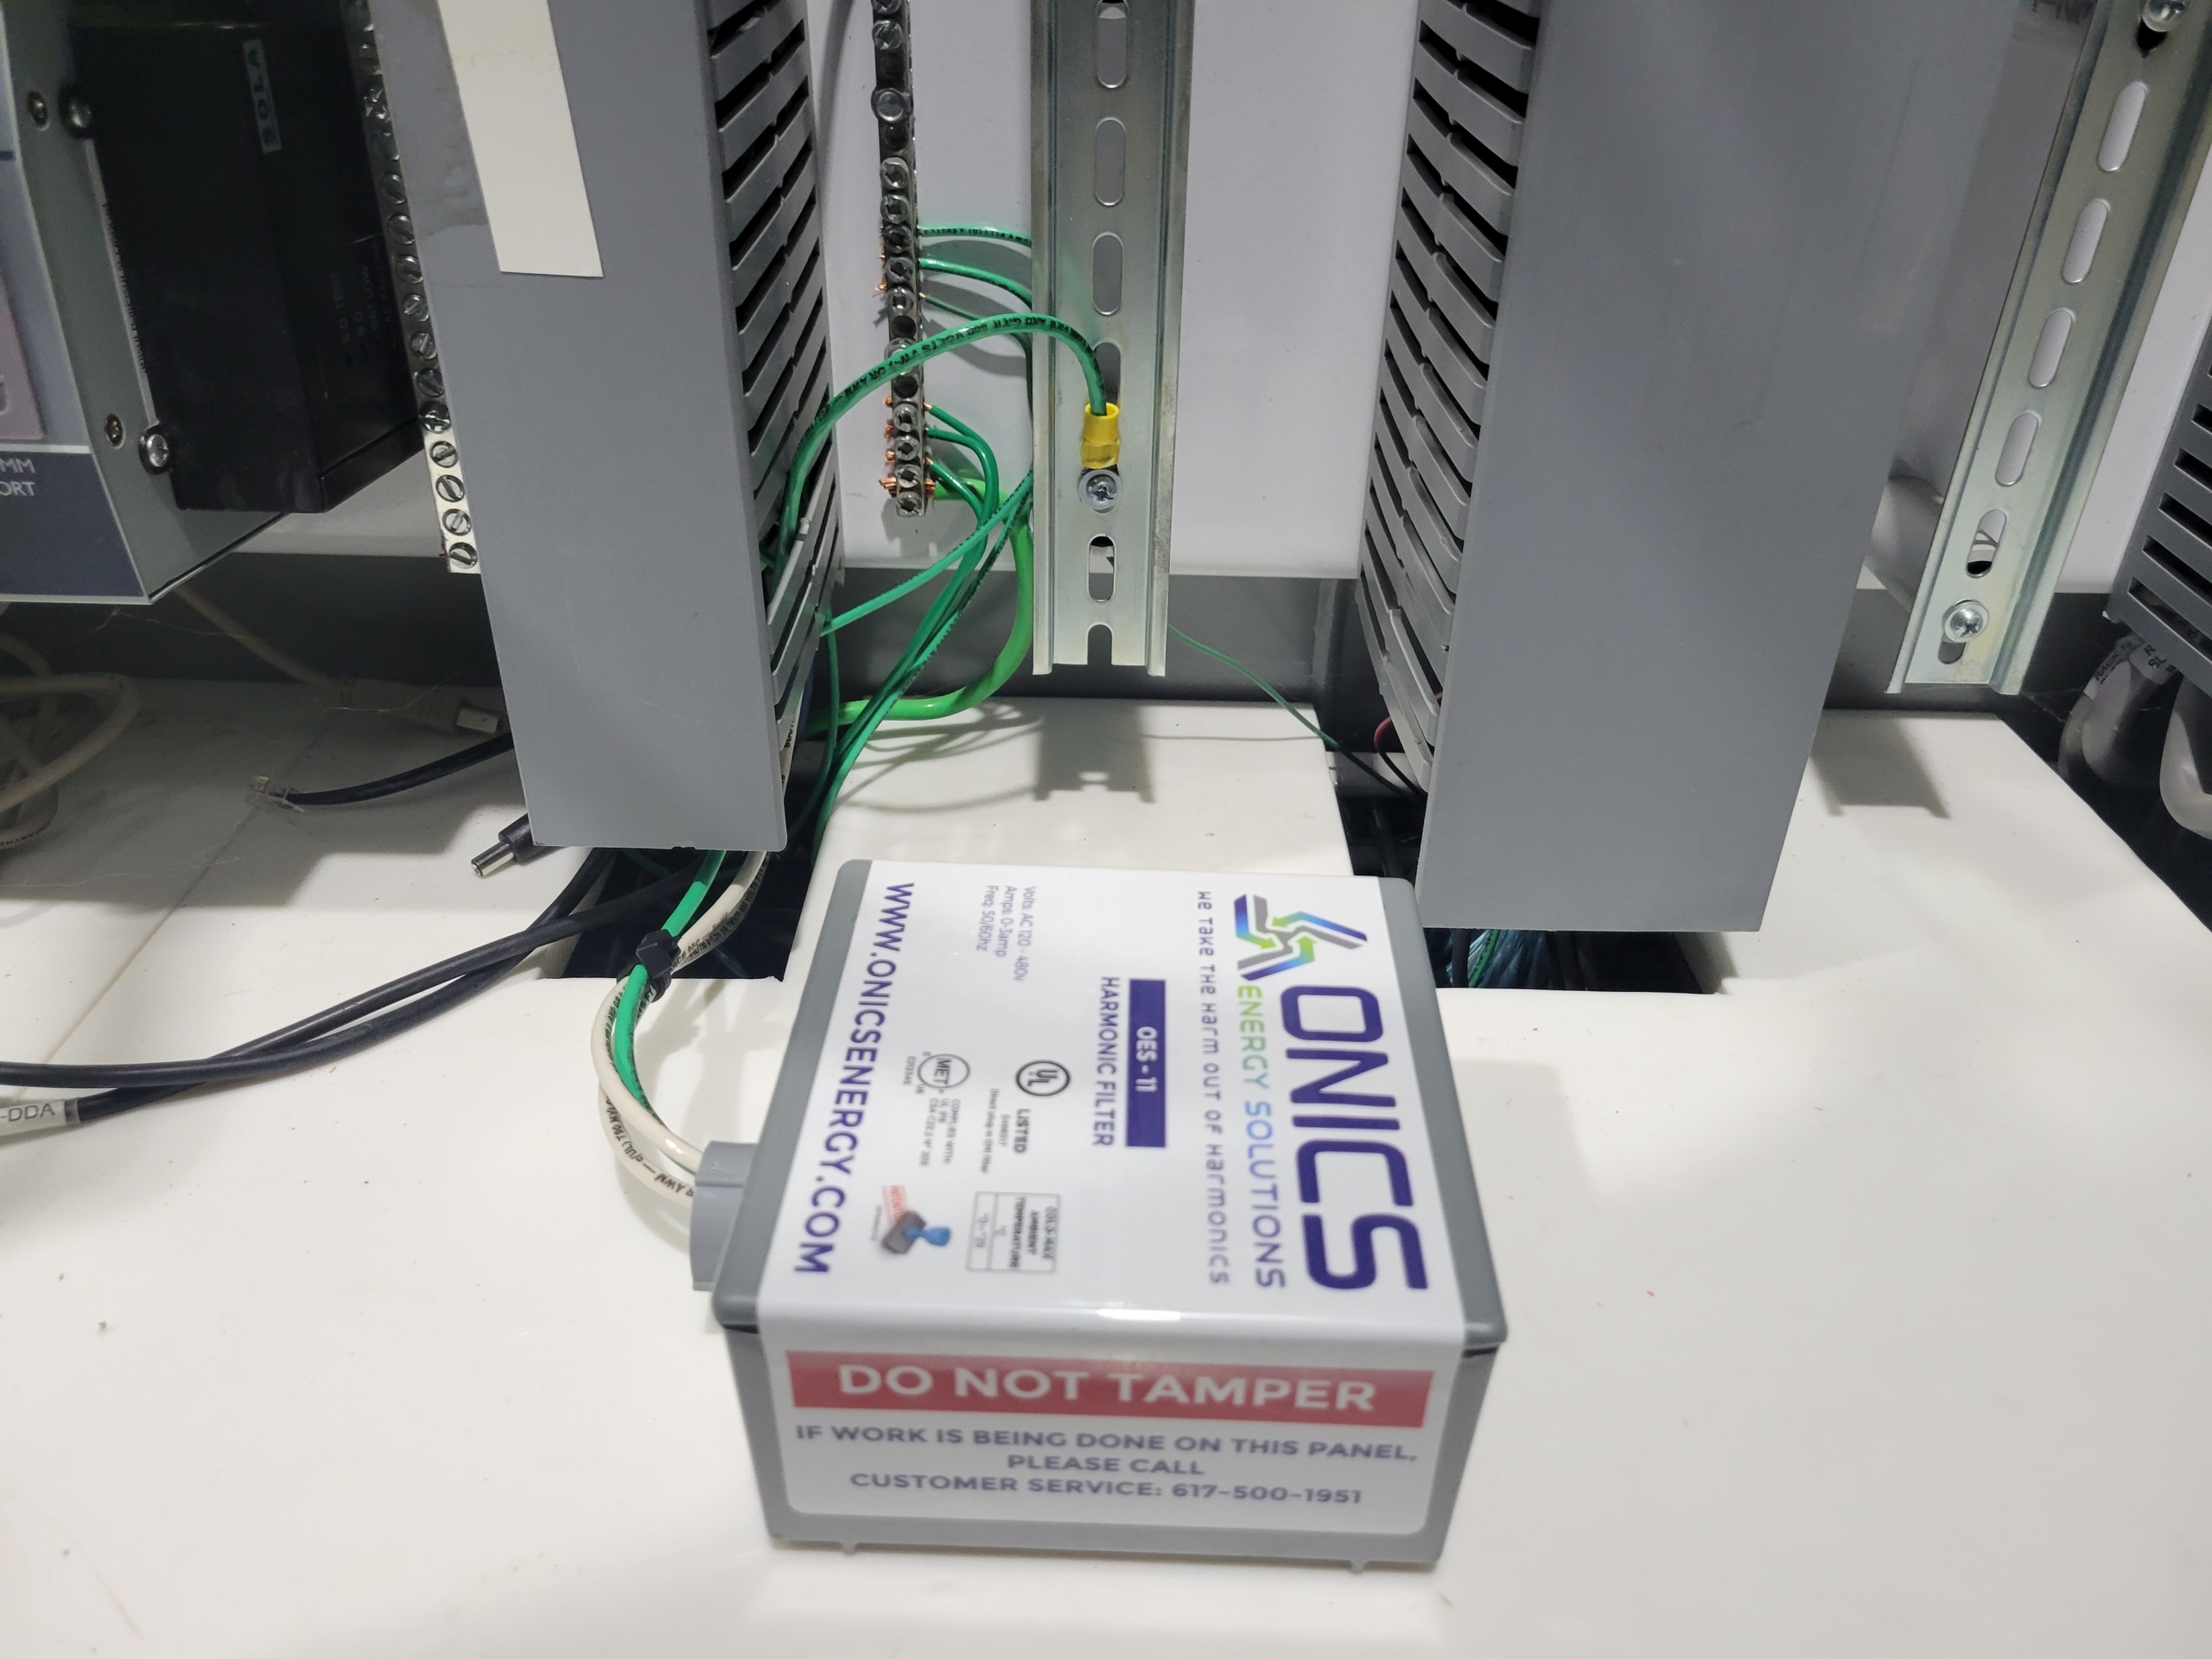
During a study on the impact of neutral and ground harmonic content we have been utilizing an ECMS-E1 continuous ESA system and cloud dashboard to monitor incoming power in order to measure the impact of harmonic filters installed throughout the facility. A survey of ground currents and kilowatt losses indicated extreme energy losses bleeding to ground and neutral and adding load to the supply transformer. Onics Energy Solutions filters were installed prior to an outage as shown in Figure 3.
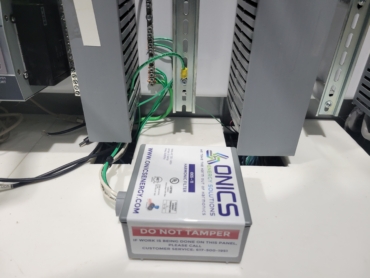
Figure 3: Onics neutral and ground filter installed at a panel ground filtering a found 12 Amps high harmonic content.
For this particular solution, shunt inductive filters are connected across all neutrals and currents in each panel and MCC ground in the facility with the combined purpose of reducing reference voltages and currents that affect electrical and electronic systems. In addition to an improvement in plant reliability measurable improvements in energy usage is observed. The data is monitored before installation, demand dropped across the two day installation period then returned to a much lower value following the site’s return to full production. The production was constant before and after.
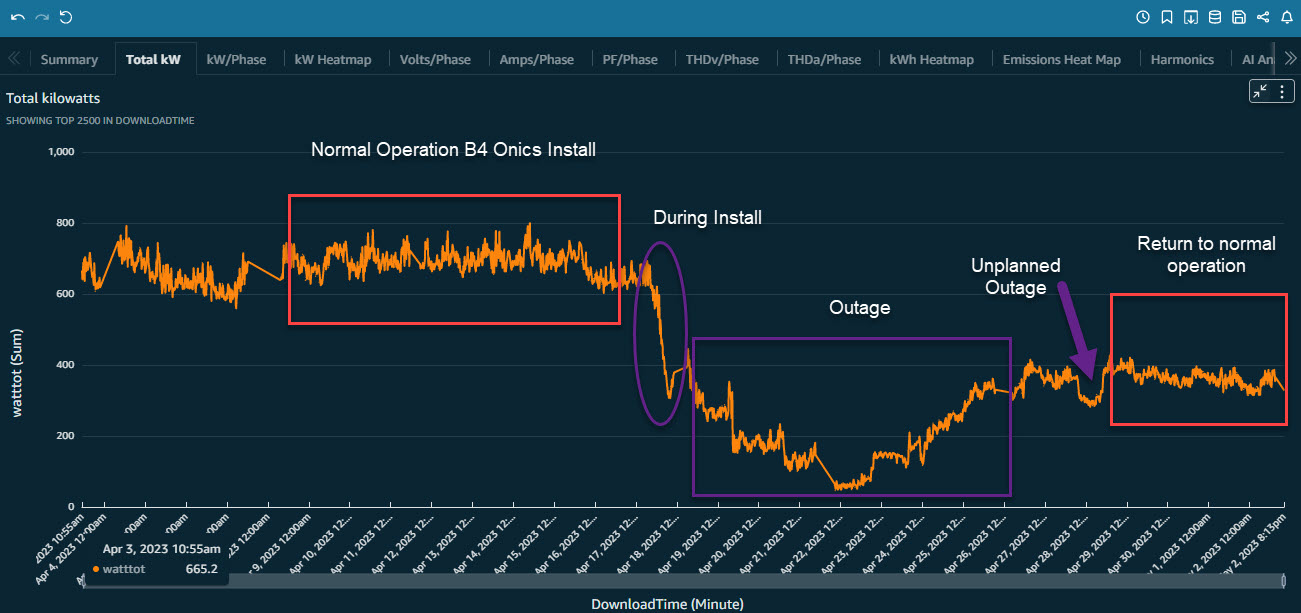
Figure 4: kilowatt demand before, during and after installation of the Onics ground and neutral filters.
The facility operates 8760 hours per year (24/7/365) with an average across this period of 679 kilowatts before installation and 363.5 kilowatts after installation. A reduction in even and odd voltage harmonics from 5.2% THD to 0.9% THD also occurred indicating severe loading and saturation of the supply transformer. This represents a drop of 315.5 kilowatts (46.5%) which is unusually higher than the average of just over 10% drop in commercial/industrial facilities. This represents 2,763,780 kWh annual demand which translates to $276,380/year and at 0.707 metric tonnes CO2/MWh, which would be ~1,955 tonnes CO2/year reduced. This also represents a sizeable drop in load on the transformer. It was noted that voltage increased from an average of 474 volts to 485 volts from the reduced kVA load on the transformer.
In both cases, the use of an ESA device to detect defects and monitor large-scale improvements provides granular and traceable information to tie reliability and maintenance improvements directly to energy and emissions programs. From friction and windage loss reduction due to lubrication to large scale reliability improvements, the losses can be directly attributed to the program instead of inferred.