About the Author
Chris Kramer
Corporate Customer Care Manager, I-care

Thermographic inspections offer many advantages as it helps to ensure a safe working environment and an increase in uptime. It also provides companies with accurate insights into the risks that undermine the continuity of their production lines (and the possibility to actively reduce these risks).
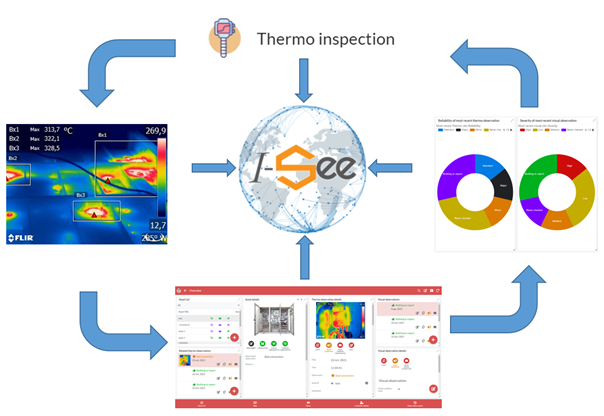
With our Infravision application, we meet our customers’ need for an objective and critical eye by effectively creating a thermographic overview and merging all available data into a single application.
But how do we do this? And how exactly does our Infravision application work? This article will give you a closer look at our working methods so you’ll know what to expect.
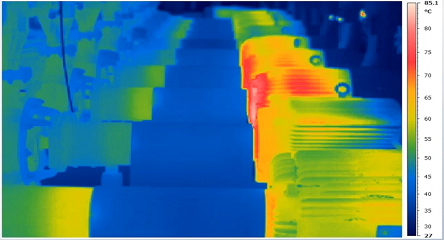
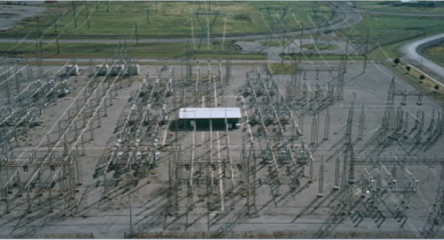
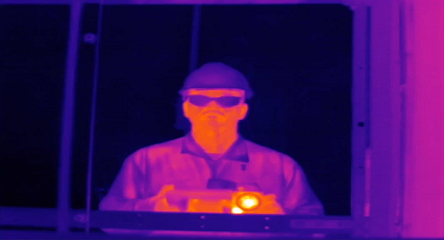
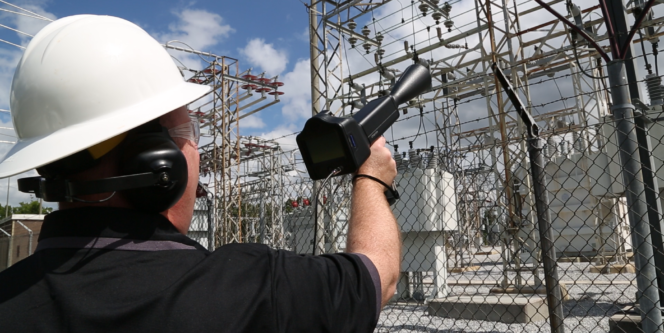
The purpose of thermographic research is to map the condition of all electrical installations in an organization, even if the organization has multiple branches or operates across borders. I-care is located in various countries and can therefore work on different locations without the need to fly anyone in. With the benefit of having local knowledge to country specific certifications and law. The inspection with use of the application is twofold: it consists partly of visual checks, where we examine installations, switch cabinets and so on, and partly of thermographic checks with heat cameras.
The camera detects heat build-up in electrical installations even before the parameters associated with the installations assume dangerous values. Moreover, we do not only use our expertise for electrical installations but for installations more generally. For example, thermographic research is also carried out on ovens at steel manufacturers. This makes it possible to detect so-called ‘hotspots’, weak spots in the oven which cause a higher energy consumption/carbon footprint and can eventually cause overheating and failure.
All data collected from the inspection is ultimately stored and visualized in the Infravision application. The app gives a clear real-time overview of the current state of the inspected installations. How many deviations are present at different locations? Where does overload occur? Are certain types of error common to specific points? Are the guidelines for working with electric cabinets in order? All this information and more is made visible to the users of the application.
The data provided by the Infravision application creates a tangible and unitary image of the state of all electrical installations within an organization. Anyone who works with these installations will instantly become more aware of what the potential risks are and what actions need to be taken on a daily basis.
In addition to the themography app, our online I-See platform provides statistics about all visual and thermographic checks. It creates overview and insight in collected data, making it a great tool for decision-making on a strategic level.